## Using LangSmith for complex agent diagnostics For teams building complex, multi-step agents within the LangChain framework who require granular visibility into nested chain execution, LangSmith is a high-fidelity diagnostic suite. Many observability tools act as simple pass-through loggers. Instead of just logging, LangSmith functions as a full-stack development environment where developers can pull a failing trace into a playground. There, they can tweak the prompt and re-run the specific step without re-triggering the entire workflow. This depth comes at a significant premium regarding data volume limits, Markaicode notes. LangSmith restricts its free tier to **5,000 traces per month**. A high-traffic support bot could exhaust its testing budget in a single afternoon of load testing. This entry point is notably tighter than other specialized LLM gateways. To compare the free monthly trace limits: | Provider | Free Monthly Traces | Operational Impact | | :--- | :--- | :--- | | [Opik](https://langfuse.com/pricing) | 25,000 | Supports full-scale production monitoring for small startups without immediate overage costs. | | [Helicone](https://www.helicone.ai/pricing) | 10,000 | Allows for consistent daily regression testing alongside standard production traffic. | | [Portkey](https://www.helicone.ai/pricing) | 10,000 | Provides enough headroom to log detailed metadata and custom headers for a mid-sized department. | | LangSmith | 5,000 | Limits the developer to primarily "golden set" evaluation and high-value debugging rather than total traffic logging. | 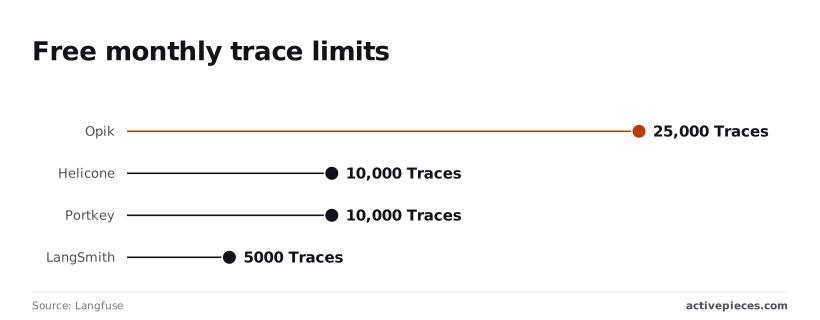 Accepting these limits is justified by LangSmith’s "Evaluators," which automate the tedious process of manual QA. Instead of a project manager clicking through 100 chat logs to see if the bot stayed on brand, LangSmith uses a "LLM-as-a-judge" pattern to score outputs against custom criteria. This infrastructure prevents the "automation drift" that occurs when teams update a base model like GPT-4o and inadvertently break three downstream regex parsers. ### Tracking prompt versions across your stack When you're managing a sprawling automation stack, the ability to see exactly which version of a prompt was active during a failure is the difference between a five-minute fix and an afternoon of forensic log digging. The interface has a clear audit trail of changes. When a department head asks why a workflow's behavior changed, you can point to the specific iteration. By looking at the versioning panel, developers can track these incremental changes, showing which iterations passed internal checks and which triggered status warnings before they hit production. This level of version control is essential for governance, but it requires a disciplined approach to prompt management that simpler logging tools often overlook. ## Deploying Helicone as a transparent proxy Helicone is an immediate observability layer. It functions as a **transparent proxy** between your application and your LLM provider, requiring only a change to your API base URL to begin logging. Because of this architectural choice, teams can bypass the deep SDK integration required by LangSmith. A developer can instrument a legacy application without rewriting its core logic. Sitting at the network level allows Helicone to capture every request and response by default. This prevents missing data points if a developer forgets to wrap a specific function in a decorator. Speed is the priority of the integration process, focusing on the minimal changes needed to redirect traffic through their gateway. By following these steps to integrate Helicone via proxy, a team can move from zero visibility to a full dashboard of request logs:  1. Generate a Helicone API Key to authenticate your requests against their middleware. 2. Change the OpenAI base_url to the Helicone gateway address to route traffic through their monitoring servers before it hits the model provider. 3. Pass the Helicone key in the headers to link the incoming data to your specific project workspace. 4. Run your first request to verify that the handshake is successful and the data is appearing in the web interface. The platform automatically begins generating cost and latency metrics for every call once these steps are complete. For a team lead inheriting a sprawling set of scripts, this visibility is the difference between guessing at a monthly budget and having a line-item breakdown of which specific prompts are driving up the bill. ### Caching and operational health This transparency extends to the platform’s caching features. By enabling a simple header, Helicone can serve repeated requests from its own cache. This reduces the total number of calls made to the LLM provider, directly lowering the operational cost of development and testing. It provides governance data even while lacking the evaluation frameworks found in LangSmith. For example, it identifies which department's API key is responsible for a sudden spike in usage. This keeps an automation stack from becoming a financial liability. The focus remains on the operational health of the system. As you scale from ten to ten thousand requests, the overhead of monitoring them doesn't scale at the same rate, which means your system becomes increasingly difficult to observe as it grows. Activepieces applies a flat meter where 1 credit covers a full flow run regardless of how many steps it contains, ensuring that breaking a complex agent into smaller, more observable modules doesn't trigger the per-task or per-module billing penalties found elsewhere. ## Activepieces Activepieces provides an MIT-licensed core for translating LLM observability data into business actions, preventing critical trace insights from dying inside a developer dashboard. When a model begins hallucinating or exceeding its token budget, Activepieces has the pre-built connectors to ensure the right department head actually sees the failure. By using a visual flow builder to link OpenTelemetry (OTLP) signals to communication tools like Slack or project management platforms like Linear, teams can automate their response to performance degradation without writing glue code that requires its own maintenance cycle. 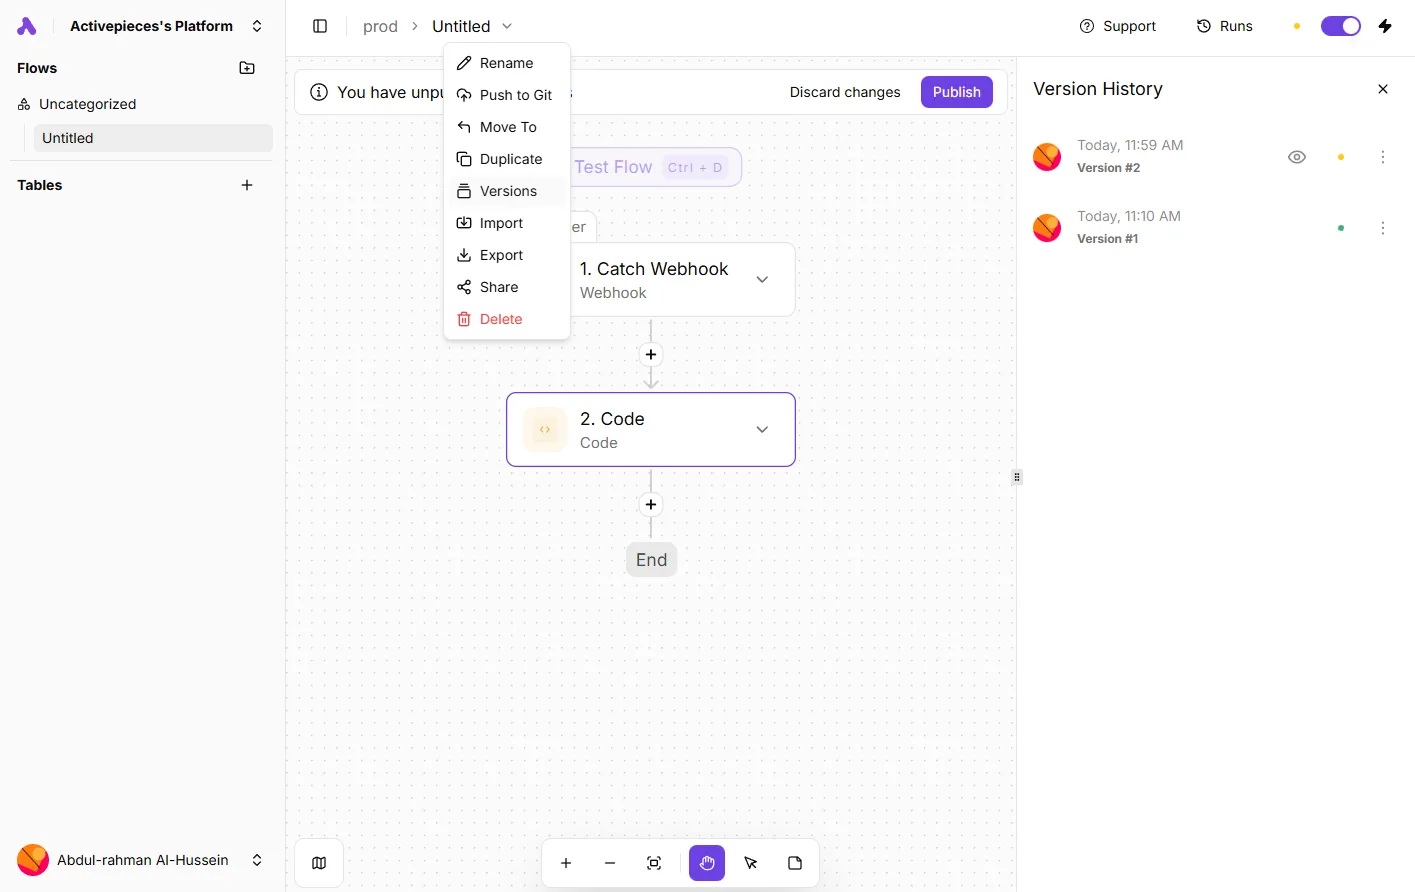 Democratization of governance is the primary value of this middleware layer. When a developer identifies a specific failure pattern in a trace, they can build a flow in Activepieces. This flow watches for that specific error tag and automatically creates a ticket in a Jira service desk. The burden of monitoring shifts from the engineering team to the department responsible for the prompt's output. A marketing lead, rather than a DevOps engineer, is the one notified when a brand-voice agent fails a sentiment check.Developers must resolve production errors within two weeks or lose the context required for a fix.
### Localized observability pipelines The entire stack can be localized to keep these automated workflows from inflating the very cloud costs the team is trying to monitor. In this setup, Arize Phoenix, an open-source evaluation platform, runs within a local Docker container to ingest traces from a Python notebook via OTLP, storing all data in a local directory. Teams eliminate cloud egress fees by keeping this traffic off the public internet. A developer can run thousands of test iterations without receiving a surprise bill from a cloud provider. This local-first architecture ensures that sensitive prompt data never leaves the internal network during the testing phase. Once the logic is sound, Activepieces can then be configured to push only high-level summary statistics to a centralized reporting tool.  Managing these integrations requires a strict approach to version control. Because Activepieces allows for self-hosting via Docker, it integrates directly into existing CI/CD pipelines. * Automation flows can be exported as JSON files and stored in a GitHub repository to track changes over time. * Production environments remain isolated from testing environments through the use of distinct environment variables for API keys. * New automation steps can be peer-reviewed before deployment to prevent a recursive loop of error notifications. By unifying the architecture of its connectors so that every piece action functions natively as an MCP tool, the platform eliminates the technical debt of maintaining separate integrations for flows and agents. Activepieces is the better fit for teams prioritizing architectural consistency and speed, as it allows developers to instantly expose their entire library of business actions to LLMs without writing custom wrappers. Through this unified framework, the bridge between observability signals and automated responses becomes a single, scalable asset for both traditional workflows and autonomous agents. ## Selecting Your Observability Stack ### Cost tracking vs agent accuracy tradeoffs Whether your immediate bottleneck is the financial unpredictability of your API usage or the functional accuracy of your agent’s reasoning determines the choice between these platforms. If your primary objective is to gain instant visibility into how much a specific department or user is spending on OpenAI credits, Helicone is a lightweight proxy. It requires changing only a single line in your base URL configuration. Cost governance can be implemented in under five minutes this way. LangSmith requires a deeper integration with the LangChain library, which adds significant architectural overhead for teams not already using that specific framework. ### Why LangSmith suits complex agent testing The necessity of rigorous testing makes LangSmith the more appropriate infrastructure choice for organizations managing complex, multi-step agents. It's a dedicated environment for "backtesting" prompts against historical datasets. Before pushing code to production, a developer can see exactly how a change in instructions would have affected the last thousand customer interactions. Helicone focuses on the "now" by capturing headers, latency, and costs as they happen. It lacks the native evaluation suites required to systematically grade the quality of an LLM's output. ### Automating governance with webhooks and alerts When these tools are connected to an automation engine, they transform from passive dashboards into active governance layers. By using webhooks to monitor specific performance thresholds, you can stop a malfunctioning agent before it drains your budget or hallucinates to a customer. * A user’s total LLM spend for the current billing cycle exceeds a predefined threshold. * A LangSmith evaluation run returns a consistency score lower than the team’s quality benchmark. * A Helicone request logs a rate-limit error, signaling that the service is scaling faster than your API tier allows. * A new trace identifies a prompt injection attempt, triggering an immediate security review of the user's session. These triggers allow a platform lead to move away from manual log reviews and toward an exception-based management style. The system notifies the relevant stakeholder only when the telemetry deviates from the established baseline, instead of requiring a daily dashboard check to see if costs are spiraling. This automated oversight ensures that as you scale from ten users to ten thousand, your observability stack acts as a circuit breaker rather than just a witness to the chaos, effectively preventing minor errors from cascading into system-wide failures, which means your infrastructure remains resilient and operational even under extreme load. MoneyGram and FundingSocieties run Activepieces in production to maintain this level of control across their automated environments. ## References - [LangChain](https://www.langchain.com/pricing) - [Langfuse](https://langfuse.com/pricing,)The burden of monitoring shifts from the engineering team to the department responsible for the prompt's output.