> ## Documentation Index
> Fetch the complete documentation index at: https://www.activepieces.com/docs/llms.txt
> Use this file to discover all available pages before exploring further.
# Autoscaling
> Measured numbers for scaling the worker fleet: pod boot time, image pull, node provisioning, and graceful drain
Workers are the unit you scale — one worker runs one flow at a time ([Production Setup](/docs/install/configure-operate/production-setup)). This page gives the **measured** answers autoscaling decisions hang on: how fast new capacity arrives, and whether removing it is safe.
**Scope:** the recommended production shape (`SANDBOX_CODE_ONLY`, `AP_REUSE_SANDBOX=true`, one flow per worker at 0.5 vCPU / 1 GB), measured on GKE with the cluster autoscaler. Other platforms differ mainly in node-provisioning time.
## How fast capacity arrives
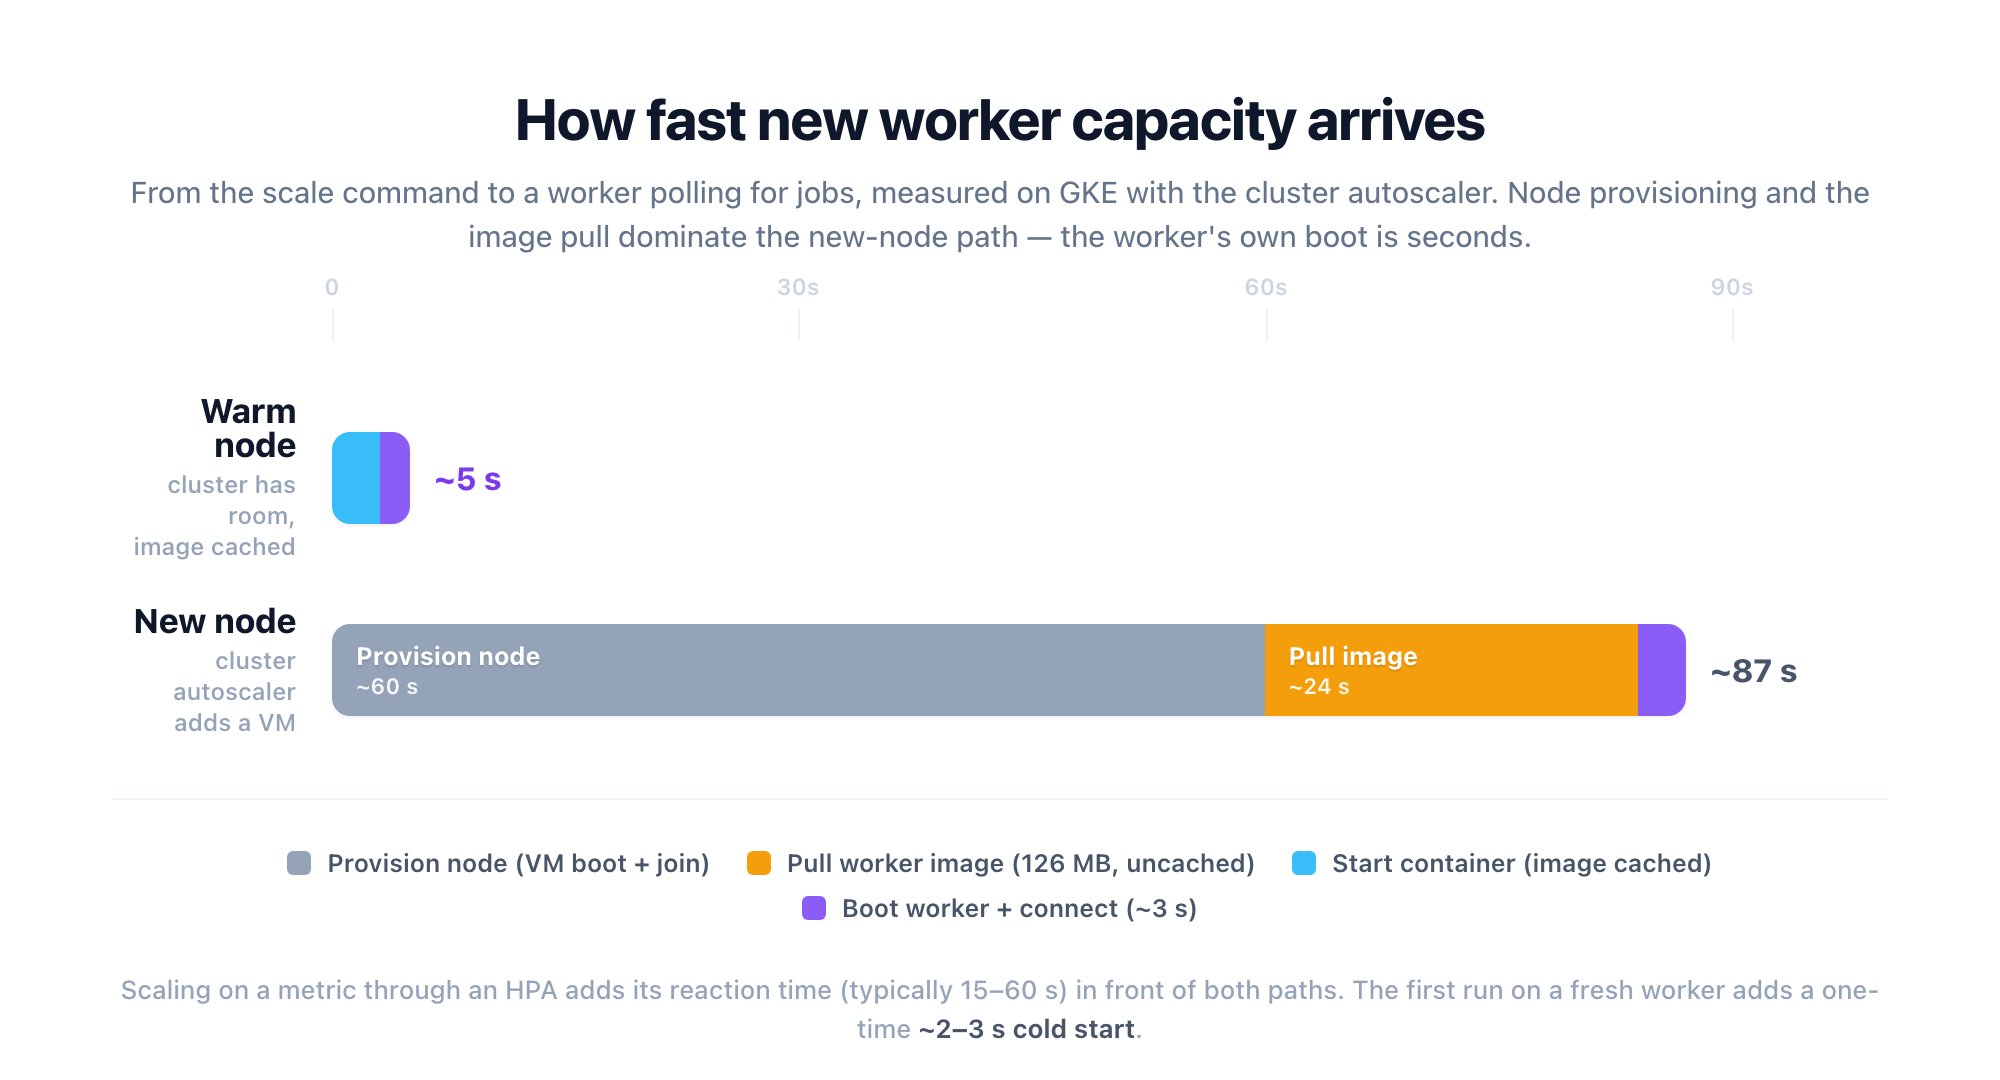 | Path | Ready to take jobs |
| ---------------------------------------------- | ------------------ |
| **Warm node** — cluster has room, image cached | **\~5 s** |
| **New node** — cluster autoscaler adds a VM | **\~85–90 s** |
Measured from the scale command to the worker polling for jobs (workers have no readiness probe — pod `Ready` only means the container started). The worker's own boot is \~3–5 s on both paths; node provisioning and the image pull are the difference.
The worker image is **126 MB** compressed — a single pre-bundled `worker.js` with no `node_modules` — precisely because the pull sits on this critical path (the app image, which you scale rarely, is 551 MB). Keep it in a **same-region registry**; the pull times above include cross-region transfer.
A new worker's first flow pays the one-time [cold start](/docs/install/architecture/latency) (\~2–3 s, piece install + engine boot); its second run is already warm.
## Scaling down is safe
| Path | Ready to take jobs |
| ---------------------------------------------- | ------------------ |
| **Warm node** — cluster has room, image cached | **\~5 s** |
| **New node** — cluster autoscaler adds a VM | **\~85–90 s** |
Measured from the scale command to the worker polling for jobs (workers have no readiness probe — pod `Ready` only means the container started). The worker's own boot is \~3–5 s on both paths; node provisioning and the image pull are the difference.
The worker image is **126 MB** compressed — a single pre-bundled `worker.js` with no `node_modules` — precisely because the pull sits on this critical path (the app image, which you scale rarely, is 551 MB). Keep it in a **same-region registry**; the pull times above include cross-region transfer.
A new worker's first flow pays the one-time [cold start](/docs/install/architecture/latency) (\~2–3 s, piece install + engine boot); its second run is already warm.
## Scaling down is safe
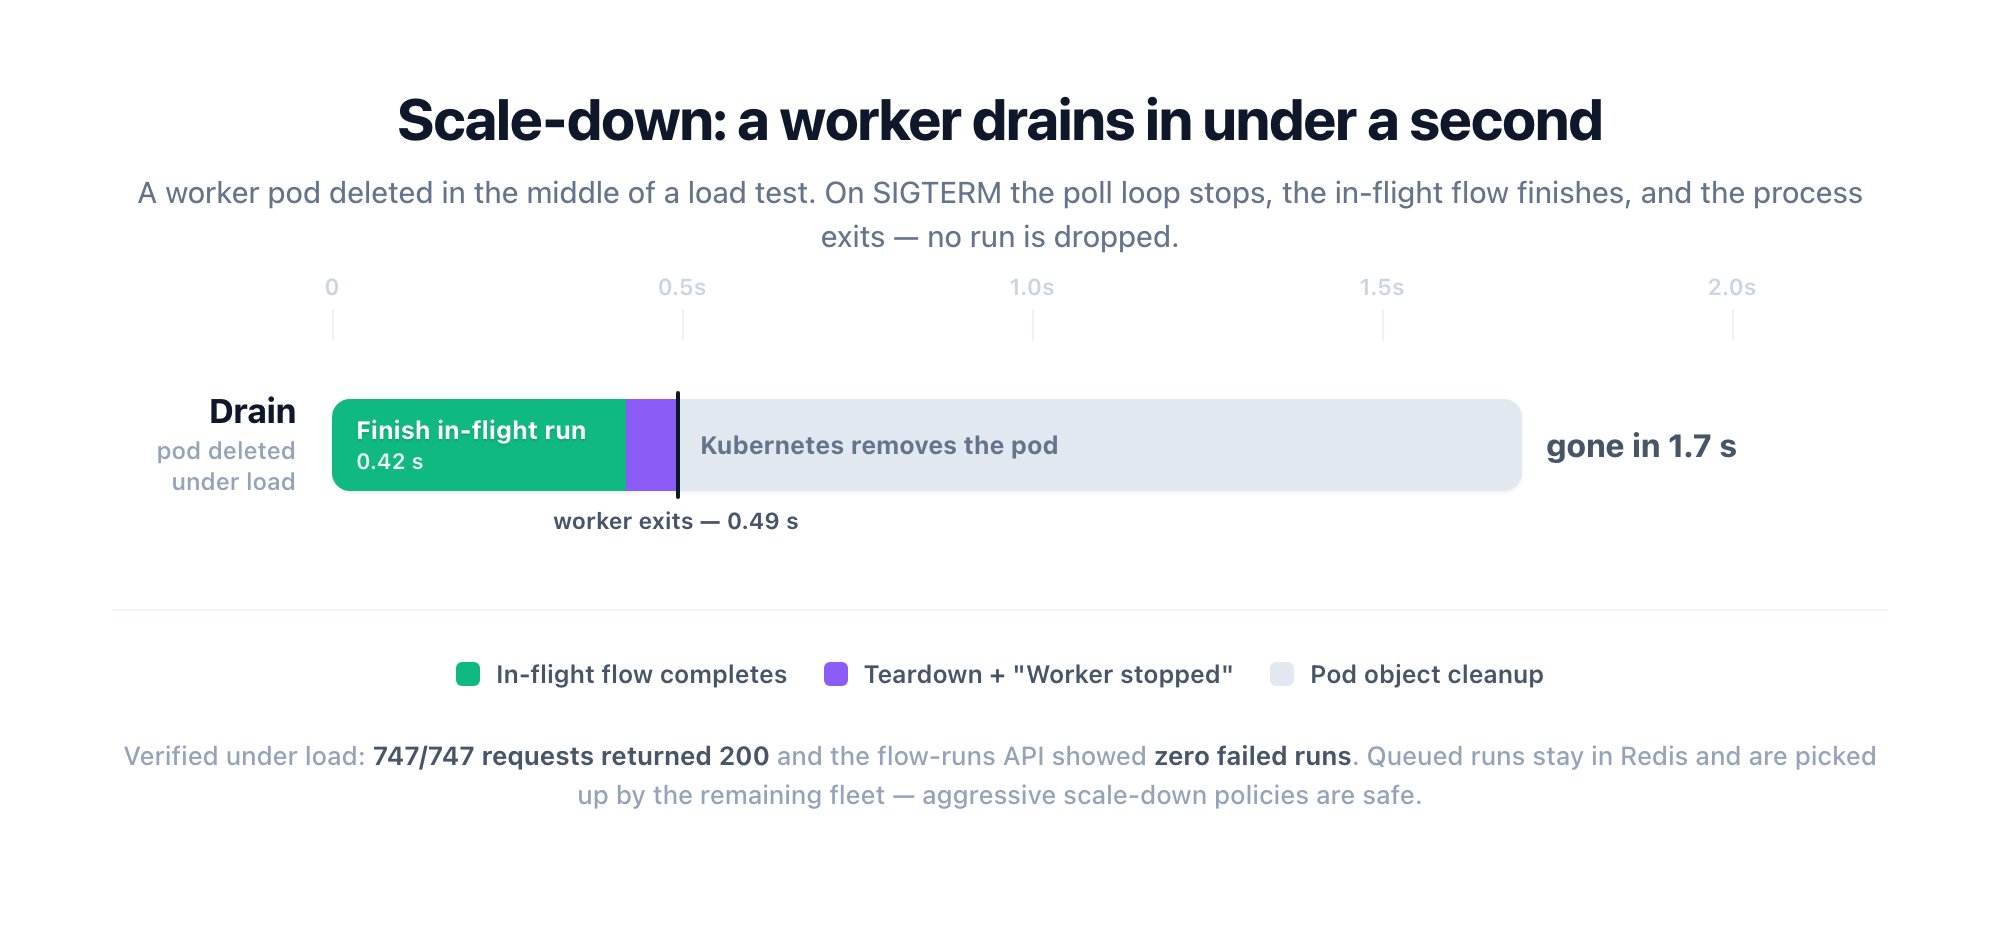 On `SIGTERM` the worker stops polling, finishes its in-flight flow, and exits (forced exit only after 30 s, matching Kubernetes' default grace period). Deleting a busy pod mid-load lost nothing: every request returned 200 and the flow-runs API showed zero failures. Runs that would have landed on the draining worker stay queued in Redis and drain to the remaining fleet.
## When to autoscale — and when not to
* **Async and scheduled workloads: autoscale freely.** Scale-up lag just shifts the backlog curve; scale on queue depth or worker CPU. Add the HPA's own reaction time (typically 15–60 s) in front of both paths above.
* **Synchronous webhooks: size statically for peak.** A burst that needs a *new node* (\~90 s) blows the 30 s sync budget before capacity arrives — hence [Production Setup](/docs/install/configure-operate/production-setup#sizing)'s pre-sized fleet. Keep **min replicas ≥ your sync peak** and let the autoscaler own the burst headroom above it.
* **Scale-down is free.** Drain is sub-second and lossless, so aggressive scale-down policies don't risk runs.
## How this was measured
GKE standard, `e2-standard-4` with the cluster autoscaler (2–5 nodes), Activepieces 0.85. Scale-ups timed from `kubectl scale` to the worker's "polling for jobs" log line via pod events and worker logs (7 warm samples, 4.6–5.0 s; new-node path timed end-to-end); drain timed from `kubectl delete pod` under `hey` load with server-side run statuses verified. Full methodology and raw logs: `benchmark/EXPERIMENTS.md` (Experiment 2) and `benchmark/data/autoscaling-2026-07-02/` in the repo. Throughput and latency for the same shape: [Benchmark](/docs/install/architecture/benchmark), [Latency](/docs/install/architecture/latency).
On `SIGTERM` the worker stops polling, finishes its in-flight flow, and exits (forced exit only after 30 s, matching Kubernetes' default grace period). Deleting a busy pod mid-load lost nothing: every request returned 200 and the flow-runs API showed zero failures. Runs that would have landed on the draining worker stay queued in Redis and drain to the remaining fleet.
## When to autoscale — and when not to
* **Async and scheduled workloads: autoscale freely.** Scale-up lag just shifts the backlog curve; scale on queue depth or worker CPU. Add the HPA's own reaction time (typically 15–60 s) in front of both paths above.
* **Synchronous webhooks: size statically for peak.** A burst that needs a *new node* (\~90 s) blows the 30 s sync budget before capacity arrives — hence [Production Setup](/docs/install/configure-operate/production-setup#sizing)'s pre-sized fleet. Keep **min replicas ≥ your sync peak** and let the autoscaler own the burst headroom above it.
* **Scale-down is free.** Drain is sub-second and lossless, so aggressive scale-down policies don't risk runs.
## How this was measured
GKE standard, `e2-standard-4` with the cluster autoscaler (2–5 nodes), Activepieces 0.85. Scale-ups timed from `kubectl scale` to the worker's "polling for jobs" log line via pod events and worker logs (7 warm samples, 4.6–5.0 s; new-node path timed end-to-end); drain timed from `kubectl delete pod` under `hey` load with server-side run statuses verified. Full methodology and raw logs: `benchmark/EXPERIMENTS.md` (Experiment 2) and `benchmark/data/autoscaling-2026-07-02/` in the repo. Throughput and latency for the same shape: [Benchmark](/docs/install/architecture/benchmark), [Latency](/docs/install/architecture/latency).