Scope: the recommended production setup (
SANDBOX_CODE_ONLY, AP_REUSE_SANDBOX=true, one flow per worker), which self-hosted deployments and dedicated Cloud workers run. The shared Cloud freemium pool uses a different sandbox. See Production Setup.What to expect
| Situation | Caller waits |
|---|---|
| Warm (the normal case) | ~0.2 s |
| Cold (first request on a fresh worker) | ~2 s |
| Under heavy load (every worker busy) | ~0.5 s |
| Timeout (flow never responds) | 30 s, then the connection closes |
Warm vs cold
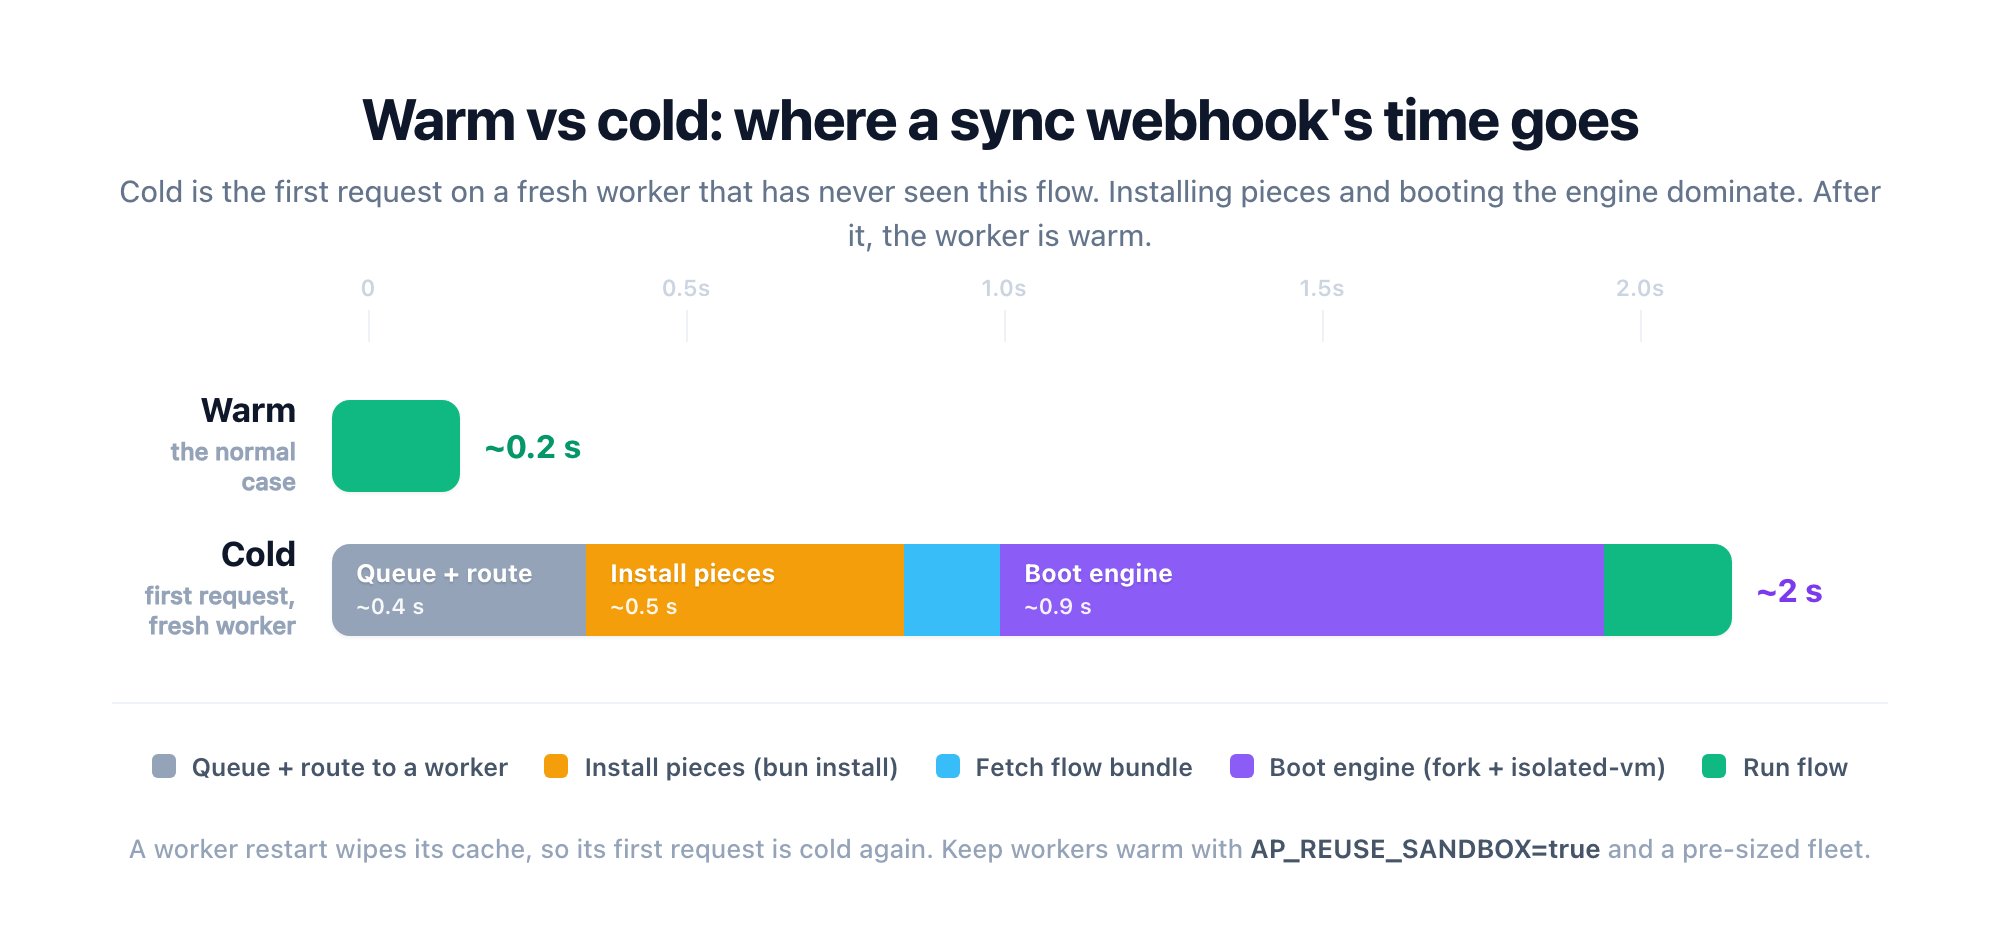
- It is the first request after a deploy, restart, or scale-up.
AP_REUSE_SANDBOXis off (then every request is cold).- A burst exceeds your warm worker count. Each worker runs one flow at a time, so the surplus queues or starts cold.
Your own work usually dominates
A warm call is almost entirely per-step bookkeeping, not your code: a progress callback per step, tens of ms each. A step that calls a third-party API waits on that API, often far longer. Next to a real outbound call, the Activepieces overhead is the smaller number.Measured (warm)
Four-step flow (webhook, math, code inisolated-vm, response), single warm call, no contention:
| p50 | avg | p95 | p99 |
|---|---|---|---|
| 163 ms | 176 ms | 260 ms | 343 ms |
The same setup measures ~165 ms unloaded but ~505 ms under sustained peak: the app tier saturating, not the flow slowing. Always ask which load a figure was measured under. Throughput view: Benchmark.
Reduce it
- Keep workers warm:
AP_REUSE_SANDBOX=trueplus a statically sized, always-on fleet. - Size for peak concurrency: N concurrent requests need N warm workers (sizing).
- Fewer, heavier steps: each step adds overhead.
- Don’t let a slow third party block the response: use an async webhook and callback instead of holding against the 30 s ceiling.