
How to Prioritize Processes for Automation: A Scoring Matrix
Automation scoring frameworks prioritize technical projects by quantifying potential time savings and complexity against existing team capacity.

Covers scaling automation from pilot to enterprise: shared-services teams, onboarding that actually gets read, and governance that holds.
ContributorSeptember 20, 202614 min read
This article was researched and fact-checked by an advanced research system.
A weighted scoring framework functions as a rigorous gatekeeper that isolates high-impact workflows, such as those automated via Activepieces, from the operational noise that frequently leads to bloated, unmaintainable technical debt.
By applying standardized metrics to every proposed script or flow, program leads can allocate engineering resources only to tasks where the efficiency gain significantly outweighs the long-term maintenance burden.
Scoring frameworks filter high-value tasks
The cost of automating the wrong process
When organizations fall into the trap of automating edge cases, the result is a "maintenance ceiling" where the team spends more time fixing broken triggers than shipping new features.
According to data from Replay, manual modernization of legacy code consumes 40 hours of developer time, which means a significant portion of the engineering budget is tied up in routine maintenance.
When organizations fall into the trap of automating edge cases, the result is a "maintenance ceiling" where the team spends more time fixing broken triggers than shipping new features.
Nobody notices the drain until a single poorly planned migration sidelines a senior engineer for an entire work week.
According to Replay, visual engineering (using structured, low-code environments like Activepieces) requires only 4 hours for the same scope, so developers can allocate the reclaimed time toward building new features.
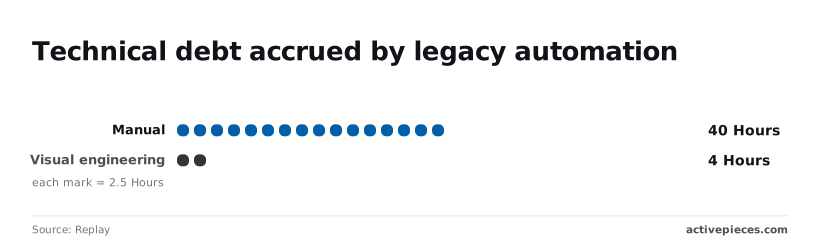
This reduces the total cost of ownership by 90% and allows the team to pivot faster when business logic changes, effectively increasing the organization's overall agility, which means the company can respond to market shifts with unprecedented speed.
The following funnel diagram illustrates how a chaotic influx of manual tasks, ranging from repetitive emails to Slack notifications, is distilled into a prioritized backlog.
Leadership passes these requests through three distinct filters to visualize how raw demand is transformed into a lean list of high-ROI deployments. This filtering process ensures that only the most resilient and impactful workflows reach the production environment.
The three core dimensions of automation value
To move beyond gut-feel prioritization, the steering committee measures every task against three specific vectors that determine its viability for the roadmap. Volume is the frequency of the task, measured in monthly executions, which defines the upper limit of potential time savings.
Complexity is the number of decision branches and external integrations involved, which dictates the likelihood of the automation breaking during an API update.
Business Value is the strategic impact, such as reducing lead response time or eliminating data entry errors in a CRM like Salesforce, which justifies the initial build cost.
This takes minutes, not a project: automate it in Activepieces free.
Track manual hours and monthly task volume
Building your scoring matrix columns
A standardized scoring matrix requires four distinct columns to isolate the raw labor cost from the technical complexity of the task.
By establishing columns for Task Name, Process Owner, Current Manual Hours, and Monthly Volume, the steering committee creates a data-backed baseline that prevents high-profile but low-impact "pet projects" from jumping the queue.
You will find that this structure ensures the specific team responsible for the output audits every entry, so the resulting ROI projections are based on actual payroll hours rather than optimistic estimates.
Scoring transaction volume and execution frequency
High-frequency tasks yield the fastest return on development time because every successful execution compounds the time saved across the entire fiscal quarter.
The following table establishes the thresholds for these metrics, allowing teams to distinguish between occasional "burst" activities and the constant background noise that drains departmental capacity.
| Metric | Score 1 | Score 3 | Score 5 |
|---|---|---|---|
| Daily Volume | Low | Moderate | High |
| Monthly Frequency | Rare | Moderate | Constant |
| Time per Instance | Low | Moderate | High |
This scoring distribution forces a distinction between a process that happens once a month but takes eight hours and a process that happens fifty times a day but takes two minutes.
Once the team locks these volume metrics, the focus shifts to the technical stability of the process to ensure the automation does not break under the weight of its own frequency.
Stage 2: Quantify process complexity and system stability
The ratio of logical decision points to the reliability of the underlying application interfaces determines technical feasibility. While high volume justifies the investment, the engineering effort scales exponentially with every additional system integrated into the workflow.
Scoring decision branches in standard operating procedures
The complexity of a process increases with every manual intervention required to handle non-standard data inputs.
We score this by auditing the number of "if-then" branches in a standard operating procedure, as each fork represents a potential point of failure where the automation requires custom error-handling logic.
If a process requires a human to interpret unstructured text from a customer email, the complexity score rises. The bot cannot rely on a fixed schema to execute the next step.
We also track the number of distinct data sources, such as an ERP system for inventory and a separate CRM for customer records. Each additional source introduces a new authentication layer and data transformation requirement.
The "Integration Complexity Ceiling" illustrates how the risk profile shifts as more platforms are introduced to a single workflow.
The Rivergroup graph shows the number of possible system connections (Y-axis) against the number of systems (X-axis), plotting 3 systems/3 connections and 4 systems/6 connections.
Adding just one more application to a process doubles the potential points of integration failure. This makes the maintenance of the automation significantly more expensive.
Adding just one more application to a process doubles the potential points of integration failure.
Consequently, we prioritize processes that touch the fewest number of systems to maintain a high uptime percentage.
Assessing the stability of underlying software applications
Automation stability depends entirely on the versioning frequency and API maturity of the target software.
We evaluate the update cadence of every tool in the stack, such as a project management tool like Jira or a communication platform like Slack, to determine how often a UI change or an API deprecation might break the existing script.
A high frequency of updates means the DevOps team must dedicate more hours to maintenance rather than building new features. We categorize these applications into three stability tiers:
- Legacy systems with no active development, providing the highest stability for UI-based automation.
- Enterprise platforms with scheduled, documented API releases, allowing for proactive maintenance windows.
- High-growth SaaS tools with forced weekly updates, which represent the highest risk for sudden workflow breakage.
By mapping these tiers against our process forks, we identify the "Technical Risk Score" that prevents us from automating processes built on shifting digital foundations.
You can follow the rest of this with the builder open. Start free, no card.
Stage 3: Calculate the final weighted priority score
The final weighted priority score transforms subjective operational pain into a numerical rank.
The framework orders the automation backlog by fiscal impact rather than which department head complains the loudest. By applying mathematical pressure to our initial discovery data, we filter out "vanity automations" and isolate the workflows that actually move the needle on overhead.
Measuring time reclaimed and error reduction value
We define the raw value of a process by multiplying the frequency of the task by the minutes required to complete it manually. This calculation reveals the total human capacity currently locked in repetitive cycles.
This metric is our baseline for "Time Reclaimed." The "Error Reduction Value" balances this figure. It is a measure of the financial or reputational cost incurred when a human makes a mistake in that specific workflow.
When a Finance Lead identifies that a manual data entry error in an ERP system like SAP results in a three-day reconciliation delay, that process earns a higher priority than a simple filing task. The cost of the error exceeds the cost of the labor.

Converting low, medium, and high ratings to scores
To calculate a score, we must convert qualitative labels into a 1-5 numerical scale. A "Low" rating receives 1 point, "Medium" receives 3 points, and "High" receives 5 points, with "Very High" reaching the maximum of 5.
This conversion allows the steering committee to apply the specific weights required for the final index. The formula is: (Volume Score × 3) + (Complexity Score × -2) + (Business Value Score × 5).
Applying weights to generate the final automation index
The automation index uses a weighted matrix to penalize technical complexity while rewarding high-volume, high-value outcomes.
This prevents the engineering team from getting bogged down in "edge-case" workflows that offer little reward. We apply a negative multiplier to the complexity score to ensure that fragile processes (those requiring frequent human intervention or complex logic) sink to the bottom of the list.
The table below illustrates how three common workflows compare when these weights are applied, showing that the highest raw volume does not always result in the highest priority.
| Process Name | Volume Score (x3) | Complexity Score (x-2) | Business Value (x5) | Final Priority Score |
|---|---|---|---|---|
| Invoice Processing | High | Medium | High | 28 |
| Lead Routing | High | Low | Medium | 24 |
| Password Resets | Very High | Low | Low | 19 |
This calculation forces a consensus on what "value" actually means for the current quarter, allowing the steering committee to defend the roadmap with objective data. Once these scores are locked, the organization can move from theoretical planning into the active build phase.
How to build your highest-scoring workflows in Activepieces
Building the highest-scoring workflows in Activepieces requires mapping the logical steps of your weighted framework directly to the platform’s visual canvas.
This ensures the build stays within technical risk thresholds. By prioritizing the "Highest ROI" candidates identified in your scoring matrix, the implementation team avoids the common trap of over-engineering low-value tasks.
Implementing logic into automated workflows
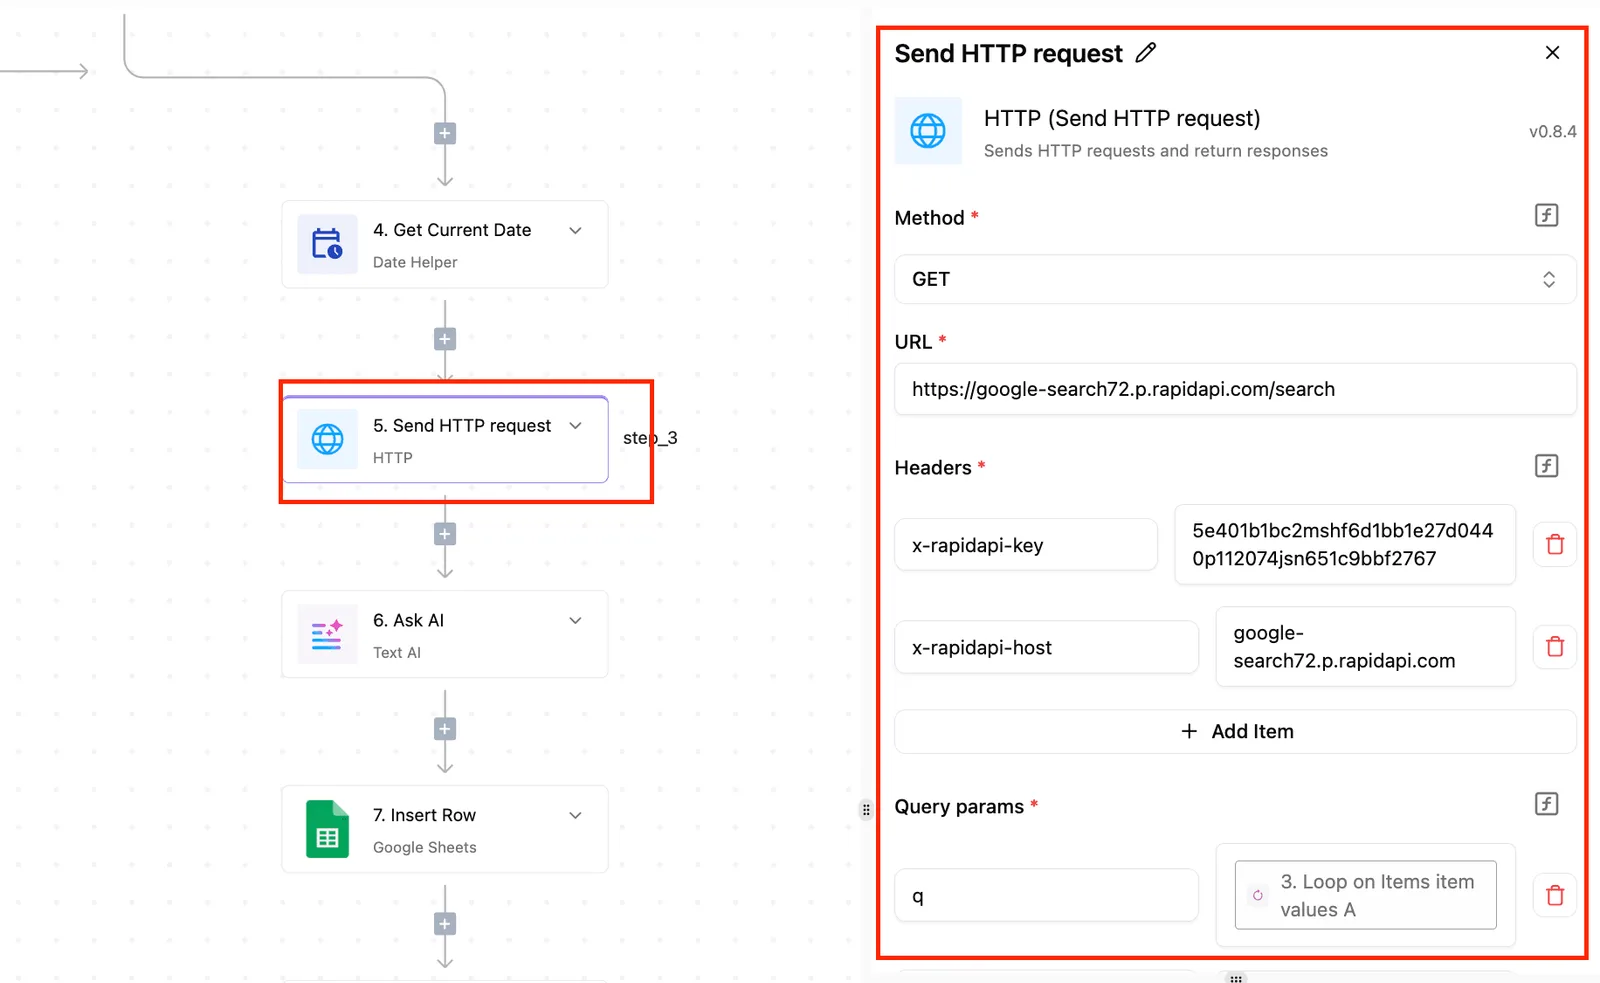
The run is the meter, not the steps inside it. Activepieces charges one credit per flow run regardless of how many granular logic blocks are used, which ensures that breaking work into smaller, more reliable steps never incurs a financial penalty.
This pricing model supports the exact discipline good automation depends on, as the vendor does not tax the builder for adding the error-handling steps that lower a framework's technical risk score.
- Select a Trigger based on the framework's identified entry point so the automation only fires when specific, high-value conditions are met.
- Sequence the Actions to mirror the manual steps documented during the scoring phase, which prevents scope creep during the build.
- Map the data outputs from one step into the inputs of the next using the platform's data picker, which reduces the chance of manual data entry errors.

Managing exceptions without breaking the automation
Activepieces manages exceptions through branch logic and error-handling steps, which prevents a single failed API call from halting the entire business process.
If a workflow hits a snag, such as a missing file in the Google Drive storage service, the system can be configured to follow a specific "False" path or a "Try-Catch" sequence.
This design choice addresses the "Operational Stability" metric in the scoring framework.
It ensures the automation either resolves the issue or alerts a human operator rather than silently failing. By building these guardrails into the first iteration, the DevOps team reduces the maintenance burden that typically follows a rapid automation rollout.
The Monday morning automation triage checklist
Standardizing the intake process ensures that the engineering team only touches tickets that have passed a formal feasibility gate. This prevents the "shadow automation" effect where regional managers script their own workarounds, which eventually break and require emergency support from the core DevOps team.
The following sequence establishes a recurring cadence for evaluating new requests against the weighted scoring framework:
The Monday Morning Triage:
- Review new submissions
- Apply the 1-5 scoring matrix
- Calculate weighted ROI
- Assign 'Quick Wins' to the current sprint
- Defer 'High Complexity/Low Value'
This progression forces a binary decision on every request. The backlog remains a list of prioritized projects rather than a graveyard of good intentions. Following this triage, the team moves into the specific mechanics of data collection.
Creating an automation request intake form
A centralized intake form is the single source of truth for all automation requests. This prevents the fragmented communication that occurs when stakeholders message developers directly on the Slack messaging platform.
You must require the submitter to define the "As-Is" process steps in this form.
This allows the reviewer to identify manual bottlenecks before any code is written. If a submission lacks a clear step-by-step breakdown, the triage lead marks it as incomplete, so the engineering team does not waste time interviewing stakeholders to uncover basic requirements.
By enforcing this documentation at the point of entry, the organization builds a library of process maps that can be reused for training even if the automation itself is deferred.
Running the first alignment and scoring session
The scoring session brings the business process owners and the technical leads together to reconcile the perceived value of a task with its actual technical difficulty.
During this meeting, the team applies a weighted matrix to each candidate. This prevents emotional pleas for "urgent" fixes from overriding projects with a higher measurable return on investment.
The output of this session is a ranked list that dictates the upcoming sprint, which means the DevOps team can point to a data-backed roadmap when explaining why certain low-value requests were deprioritized.
This transparency reduces friction between departments, as every stakeholder can see the specific criteria (such as API availability or data cleanliness) that determined their project's rank.
Frequently asked questions
How often should we update the scoring weights?
Review your scoring weights at the start of every fiscal quarter to ensure the framework aligns with current board-level objectives.
When the executive team shifts focus from aggressive customer acquisition to operational cost-cutting, a static framework will continue to prioritize front-end lead generation tools over back-office efficiency.
This quarterly cadence allows the Center of Excellence to adjust the "Strategic Alignment" multiplier before the next sprint planning session, so the engineering team is never building against obsolete priorities.
What should we do when two tasks return the same score?
Break a tie by prioritizing the task with the lower "Technical Debt" score to ensure the team maintains high velocity through the quarter.
When two projects offer identical ROI, the project utilizing modern REST APIs (a standardized method for software communication) should always precede a project requiring custom middleware.
The former reduces the long-term maintenance burden on your DevOps team.
If the technical risk is also identical, the decision-maker should select the process owned by the department with the highest "Automation Readiness" rating.
This ensures the first deployment goes to a team that has already cleaned their data, which increases the likelihood of a successful internal case study.
Should we score tasks that rely entirely on legacy systems?
Include legacy-dependent tasks in the initial audit but apply a heavy penalty to their "Feasibility" score to prevent them from stalling the roadmap.
Legacy systems often lack accessible endpoints, meaning a developer might spend weeks writing custom scripts just to extract data, which inflates the cost per automation and lowers the overall program ROI.
By scoring these tasks, you create a documented paper trail that justifies why certain "high-value" manual processes remain manual.
This data gives the steering committee the evidence needed to fund a modern ERP (a comprehensive business management suite) rather than wasting budget on fragile workarounds for aging software.
Related reading
References
Build it
Set this up in minutes.
No code required. Connect your accounts, and Activepieces runs it from there.
Start free Talk to sales