
How to Build a Datadog to Snowflake Integration

Nov 17, 202616 min read
Starting with Datadog Snowflake integration
What a Datadog Snowflake integration is
In practice, a Datadog Snowflake integration is a workflow, built in a tool like Activepieces or written by hand, that moves data between the two on a trigger: Snowflake rows become Datadog logs, or a Snowflake query runs when something happens.
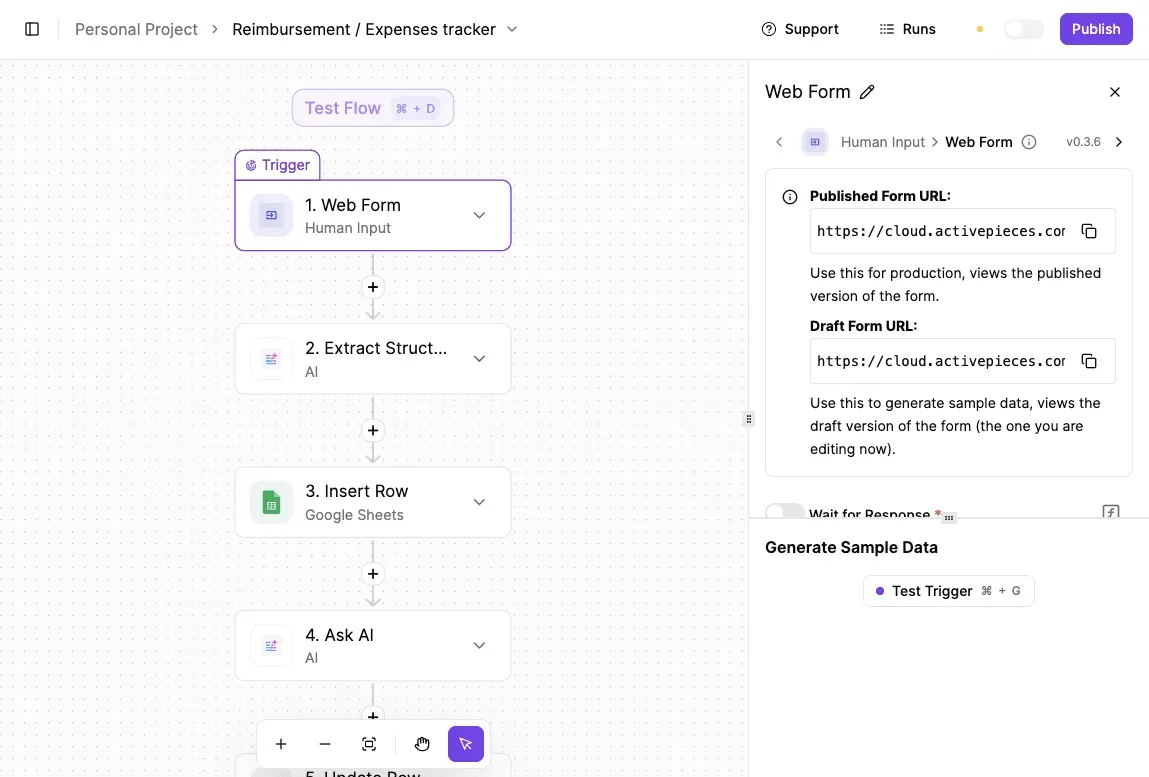
The fastest version is a small no-code flow, not a script or a native monitoring integration.
Use the listed steps where they exist. Where Datadog has an endpoint with no listed step, send an HTTP request.
A script means hosting, credentials and retry logic you then own. A native monitoring integration pulls Snowflake's own usage metrics, which is a different job from moving your table data.
Common Datadog Snowflake integration patterns
You will end up building one of three patterns. Here they are, in the order I'd build them, with the simplest first. Activepieces builds each as a trigger plus one action.
- A Snowflake "New Row" trigger feeds a Datadog "Send One log" action, so each new row becomes one log entry.
- A Snowflake "Run Query" action feeds a Datadog "Send Multiple logs" action, so one scheduled query ships a whole batch.
- A Datadog "Custom API Call" action reaches any endpoint that has no listed step.

When the events are low-volume and you want to see them immediately, use the first pattern. When one log per row would be noisy or slow, use the second.
Pick the batch pattern early if your table grows fast. The third is your fallback, and it means a missing step never blocks the build.
Gather these before opening the builder, because a missing one stalls the flow midway:
- A Datadog API key, plus an application key if you plan to use the custom call against endpoints that require one.
- Your Datadog site, such as US or EU. A key from one site won't authenticate against another, and the error rarely says so plainly.
- A Snowflake account identifier, a user, and a role that can read the target table.
- A running warehouse the user may use, since queries won't execute without compute.
- The exact table or query you want to ship, with columns you're happy to see in a log.
That last point matters most. Anything in a row becomes searchable by everyone with log access in Datadog, so trim sensitive columns in the query, not afterward. Check Datadog's log intake documentation for payload limits before you design the batch size.
**Anything in a row becomes searchable by everyone with log access in Datadog, so trim sensitive columns in the query, not afterward.
This takes minutes, not a project: automate it in Activepieces free.
Five Snowflake and Datadog workflows worth building
Four of the five flows below run on listed steps alone, and together they cover most of the work.
Datadog has no triggers in the public Datadog piece, so every flow starts on the Snowflake side or on a webhook. The table shows which step each flow uses, so you can see where you'll need a raw HTTP request.

| Trigger | Action | Listed step or HTTP request | Benefit |
|---|---|---|---|
| Snowflake "New Row" | Datadog "Send One log" | Listed | Each new row becomes a searchable log line |
| Schedule | Snowflake "Run Query", then Datadog "Send Multiple logs" | Listed | One query result ships as a batch |
| Datadog webhook | Snowflake "Insert Row" | Listed trigger-side gap, so webhook | Alert history lands in a table you can join |
| Snowflake "New Row" in an errors table, then a filter | Datadog "Send One log" | Listed | Only pipeline failures reach Datadog |
| Snowflake "New Row" | Datadog "Custom API Call" | HTTP request | Reaches Datadog endpoints with no listed step |
Prices and plan limits checked against activepieces.com and activepieces.com on November 17, 2026.
Start with the first two rows, since they need no custom code. The paragraphs below say what each one gets you.
Use "Run Query" from the Snowflake piece on a schedule, then pass the rows to "Send Multiple logs". You get one aggregate, such as failed loads per table, in Datadog without anyone opening Snowflake. Keep the batch small enough to fit Datadog's intake limits.

Because Datadog offers no trigger, point a Datadog webhook at the workflow's catch-webhook URL. Then write each payload with "Insert Row". Your alert history ends up in a table you can join against deploys, tickets or load times.
For pipeline problems, trigger on "New Row" in whatever table records load errors, then add a filter step so only failed or late runs continue. "Send One log" does the rest. On-call sees pipeline failures and nothing else.
When you need something beyond "Send Multiple logs", "Send One log" and "Custom API Call", posting an event for one, there is no listed step.
Use "Custom API Call" with the endpoint and your API key in the header, and treat it as a single step inside an otherwise listed flow.
Building one Snowflake to Datadog workflow in Activepieces
Build it as a trigger, a Snowflake query step, and a Custom API Call that posts to Datadog, tested step by step before you publish.
Other automation tools connect these two apps as well.
Activepieces fits when you want open source and self-hosting: its core is MIT-licensed, and the Snowflake and Datadog integrations used here sit among the 750 integrations counted directly from the open source monorepo on GitHub, in the packages/integrations/community directory, where roughly 60% were contributed by the community rather than the vendor.

Step 1: Create the workflow and pick the trigger
Create a new flow and choose a Schedule trigger so the flow runs on a fixed interval.
A schedule is the safer starting point because it makes the cost of each run predictable: every run is one query against Snowflake, so a short interval means more warehouse time billed to you.
Pick the longest interval your alerting can tolerate.
Inside the builder, a flow is a vertical chain, trigger on top, with the selected step's settings in the right panel.
In the screenshot below, a Discord "New Message" trigger exposes Connection, Limit and Channel fields, and every trigger in your flow will have the same kind of panel.
Note the "Publish" button and the unpublished-changes banner: nothing you build runs live until you publish.
Step 2: Connect Snowflake and Datadog
Add the listed Snowflake step and create its connection from the step's Connection dropdown. Use a Snowflake user whose role can read only the tables you're reporting on.
Then add a Custom API Call step for Datadog, with the endpoint and your API key in the header, as described above. Keep the key in the step's header field and out of any query text, since step inputs show up in run logs.
Once both steps are connected, step 3 is mapping the fields. Write the query in the Snowflake step, and select only the columns Datadog needs.
Then, in the Custom API Call body, insert each column from the query step's output into the matching field of the Datadog payload.
- Choose the metric or event name Datadog will receive.
- Map the value column from the Snowflake output.
- Map a timestamp column so Datadog plots the point when it happened, not when the flow ran.
- Add any tags you filter on.
Before anything goes live, step 4 is testing and publishing. Test each step in order, starting with the trigger and then the query. Confirm the output shows the rows you expect before the Datadog step uses it.

Run the Custom API Call last and check that the point appears in Datadog. If the response is an authorization error, recheck the header first. Once it passes, click Publish.
You can follow the rest of this with the builder open. Start free, no card.
Troubleshooting Datadog Snowflake connection errors
Once published, a flow fails in one of six predictable ways, and each has a short fix. The table below pairs what you'll see in the run log with its cause, so you can match the symptom first and change only one setting.
| Problem | Symptom | Cause | Fix |
|---|---|---|---|
| Auth | 401 or 403 on a step | Expired key, or a role without access | Reissue the key; grant the role read access to the table |
| Query timeout | Run stops mid-query | Query scans too much data | Filter by time window; use a larger warehouse |
| Payload size | 413 from Datadog | Batch exceeds 500 KB for metrics or 5 MB for logs | Split rows into smaller batches |
| Rate limit | 429 responses | Too many calls per window | Batch and add a delay |
| Wrong Datadog site | 403 on valid keys | Request sent to the wrong regional domain | Match the URL to your account's site |
| Duplicate or missed runs | Repeated or absent rows | Retries, or a window that overlaps or leaves gaps | Track a high-water mark |
Start with the two that account for most first-day failures, then work through the rest; every fix is covered below.
When a key you know is valid returns a 403, the usual cause is the wrong site (see the table), not a bad key.
A 401 from Snowflake means the role running the query can't see the table, so grant SELECT to that role before you regenerate anything.
Send a metrics payload above 500 KB or a log payload above 5 MB and Datadog rejects it, so a large query result must be chunked before it's sent.
A single oversized batch fails whole, and you lose every row in it. Chunk by row count, not by time.
Snowflake and Datadog integration costs
Each time a scheduled query runs, it wakes a warehouse, and a credit costs $2 on Standard, $3 on Enterprise and $4 on Business Critical, which means teams often don't realize the total cost of their background queries.

The same trigger therefore costs twice as much on the top edition.
On the Datadog side, Pro hosts run $15 to $18 a month and Enterprise $23 to $27. The lower figure is the annual rate, so commit annually if the host count is stable.
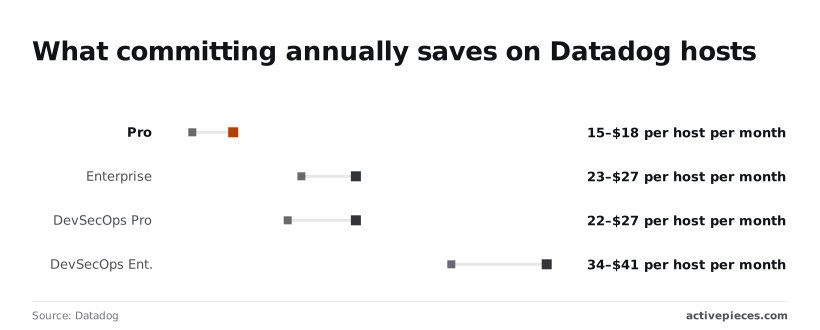
DevSecOps Pro is $22 to $27 and DevSecOps Enterprise $34 to $41, which only pays off if you use the security features.
When a retry fires, it re-sends the same rows, and a fixed "last hour" window drops anything that arrives late. Store the timestamp or ID of the last row sent, and start the next query from it.
The Strongest Case Against a No-Code Workflow Here
If you already own a script or a Snowflake task, adding a workflow tool means a second place for the job to fail and a second credential to guard, and that's a fair reason to prefer Datadog's own Snowflake integration, or the script or task itself.
If you already own the tooling, the "fastest" claim needs defending, so here's the objection at full strength.
Nobody on your side has to build the native integration, because Datadog maintains it. It pulls Snowflake account metrics into Datadog, so you get monitoring with no glue to own.
A script or a Snowflake task lives in your repository or your warehouse, runs under accounts your security team already reviews, and puts no third party between your data and your dashboards.
Both are real advantages, and for pure monitoring the native integration is the right call.
What each one actually does is where the objection runs out. The native integration reads Snowflake's own usage and performance data into Datadog. It doesn't run your query and push the resulting rows as events or logs.
That job falls to a script or task, which means someone writes it, schedules it, handles pagination and retries, and gets paged when it dies at 3 a.m. with nothing in the logs.
| What it does | Who maintains it | What happens when it breaks | Extra credential | |
|---|---|---|---|---|
| Datadog native Snowflake integration | Reports Snowflake account usage and performance metrics into Datadog | Datadog maintains the integration; you maintain its Snowflake user and permissions | Metrics stop arriving or go stale; the fix is usually a permissions or configuration change | A dedicated Snowflake user for Datadog |
| Script or Snowflake task | Runs your own query and sends the rows wherever your code says | Your team, including retries, scheduling and dependency updates | Fails silently unless you added alerting; someone has to read the code to diagnose it | A Datadog API key stored in your code or warehouse secrets |
| Workflow tool | Triggers on an event, runs listed steps, and uses an HTTP request where no step exists | You maintain the flow; the vendor maintains the platform and its steps | A failed run shows up in the run history, but you now depend on a third party being up | Snowflake and Datadog credentials stored in the tool |
Read down the table and the pattern is plain: the workflow tool doesn't remove a failure point or a credential; it moves them.
What you buy is that the run history is readable by someone who didn't write it, and that a new trigger takes minutes rather than a code review.
Whether that's worth the third-party dependency is the real decision, and the next section tests it.
Building your first Datadog Snowflake workflow
Pick one handoff that someone currently does by hand, build it as a small workflow, and leave the native integration to the job it already does well.
The objection is fair: the native integration covers Snowflake's own usage metrics, a workflow covers event-driven handoffs between the two tools, and a script covers both but leaves you maintaining it.
Choosing your first Datadog Snowflake workflow
Look for the copy-paste someone does after every alert. A typical case is a Datadog monitor firing and an analyst then logging it in a Snowflake table so incidents can be joined against business data.
That's a trigger, one action, and no judgment, which makes it a good first flow. Skip anything that fires on every event, because you'll hit API rate limits on one side or the other before you notice.
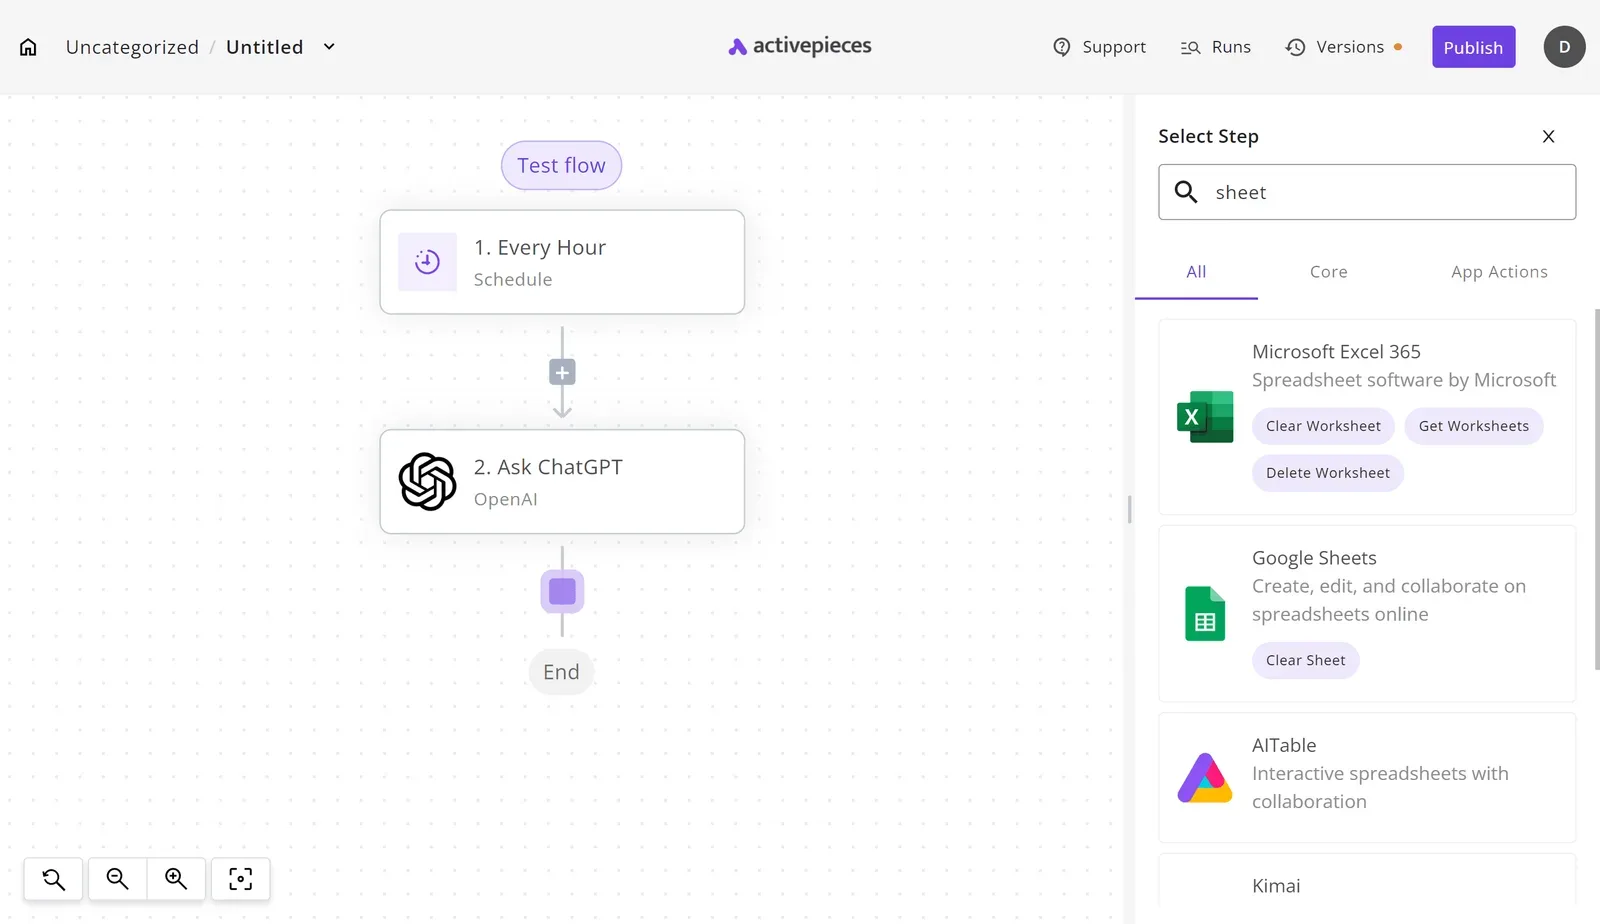
- Write the flow as a single sentence: "When this happens in Datadog, add this row in Snowflake." If it needs an "and then", it's two flows.
- Make the Snowflake and Datadog connections with a dedicated Snowflake user with write access to one table only, and a Datadog key created for this workflow alone. If either one is revoked or rotated, you'll know exactly what broke.
- Test one record end to end. Trigger a single real alert, or a test monitor, and confirm the row lands in the table with the fields you expect. Fix mapping problems now, while there's one row to inspect.
- Turn it on in the workflow builder, then check the table after the next genuine alert rather than assuming it worked.
Four steps, and the build is done. What remains is deciding which jobs should not go through it.
When the native integration is enough
If all you need is Snowflake's own usage and performance metrics visible in Datadog dashboards, use the native integration and stop there. Nothing in that job needs a trigger or a handoff, so a workflow would only add a dependency.
Reach for the workflow when data has to move because something happened, and reach for a script only when the logic outgrows what the steps can express.
Frequently asked questions
Does Datadog have a built-in Snowflake integration? Yes, but it's a monitoring integration: it pulls Snowflake usage and performance metrics into Datadog, and it doesn't move your own rows or events between the two on a trigger.
If the goal is dashboards of Snowflake's own health, use it. If the goal is "when this happens, send that data over there," you need a workflow.
Can I connect Snowflake and Datadog without writing code? Yes. Start the flow from a schedule or a webhook, because Datadog has no listed trigger to start from.
Use the listed Snowflake step to run the query, then an HTTP request step to post the result to Datadog's API. Every field is filled in through forms, and no script is deployed.
What if the step you need is missing?
Use an HTTP request step and call the Datadog or Snowflake API directly. The authentication and body are the same ones the API docs describe.
Pick the Datadog site that matches the URL you log in at, because API keys are tied to one site and a request to the wrong one comes back as an authorization error.
Check Datadog's documented size limit for log submissions too, and have the flow send in batches rather than one giant payload.
Can I self-host the workflow that connects them?
Yes, if the workflow tool is open source and offers a self-hosted edition. Running it yourself keeps Snowflake credentials and query results inside your own network, which is often what a security review asks for.
The trade-off is that upgrades, backups and uptime become your job. For a first test, a hosted free plan or trial is the faster way to see whether the flow works at all.
How do I stop a flow from sending the same data twice?
Keep a cursor. Store the timestamp or ID of the last row sent, query only for rows past it, and update the cursor after Datadog accepts the batch, not before.
Datadog's log intake won't reject a repeat for you, so an overlapping window means duplicate events in your dashboards. If a run fails halfway, leave the cursor where it was, so the next run resends the batch instead of skipping it.
Related reading
Build it
Set this up in minutes.
No code required. Connect your accounts, and Activepieces runs it from there.
Start free Talk to sales