AI Agent SLA Monitoring Tools Compared for Teams

Nov 22, 202614 min read
Langfuse is an open-source tracing, evaluation and cost-tracking tool that you can run on your own servers.
It fits teams that must keep trace data in-house but have little appetite for building alert routing on top of it, whether that means wiring notifications through a workflow tool such as Activepieces or simply living without them.
Whichever agent library produced them, the traces look the same, because Langfuse is framework-neutral. It records what an agent did, what each step cost and how evaluations scored it.
Pick it for self-hosting. Prompts and outputs stay inside your network, which settles most data-residency questions before legal asks them. A small operations team also gets one place to read traces without sending customer text to a third party.

Whether last quarter's incident is still readable comes down to retention, so confirm current limits on the vendor's pricing page before you commit. A hosted cloud version exists with its own tiers.
Prices and plan limits checked against docs.claude.com and claude.com and openai.com and gemini.google on November 22, 2026.
Langfuse self-hosted tracing and evaluation
Langfuse alerting and SLA reporting limits
Langfuse measures, and it doesn't page anyone. That is the limit every tracing tool shares. Treat its alerting and SLA reporting as lighter than a dedicated response workflow, and verify in the current docs what it can notify on and where.
A dashboard that nobody opens at 3 a.m. isn't an escalation path. If a team needs a named human woken when a threshold breaks, something downstream such as Activepieces has to take the signal and act on it.
A dashboard that nobody opens at 3 a.m. isn't an escalation path.
That's why the comparison uses the same seven questions for every tool, applied here to Langfuse:
- Response time: does it report how long the agent takes to answer, per step and end to end, with a stated measurement window?
- Task success rate: can evaluations or scores show how often the agent finished the job it was given?
- Escalation time coverage: when a failure happens outside working hours, does anything route it to a person, or does it only record it?
- Alert quality: can you set thresholds that fire on real breaches without burying the on-call person in noise?
- Self-hosting: can the whole system run on your own infrastructure, with traces never leaving it?
- Price at volume: what does the bill look like when trace counts grow tenfold?
- Stack fit: does it work with the agent framework and apps you already run, without rewriting them?
The open questions for Langfuse sit in escalation coverage and alert quality, while it scores well on self-hosting and stack fit. The sections that follow hold every other tool to the same seven.
The fastest way to settle a shortlist is to try one. Activepieces is free to try, no credit card.
Datadog LLM Observability for agent SLO monitoring
Datadog LLM Observability puts agent traces beside the monitors and SLOs you already run. That makes it the natural fit for a team already on Datadog with on-call routing wired up.
The reason is operational. Your latency SLO, your error-rate monitor and your pager schedule already exist, and you can attach an agent's behavior to them instead of keeping it in a second console.
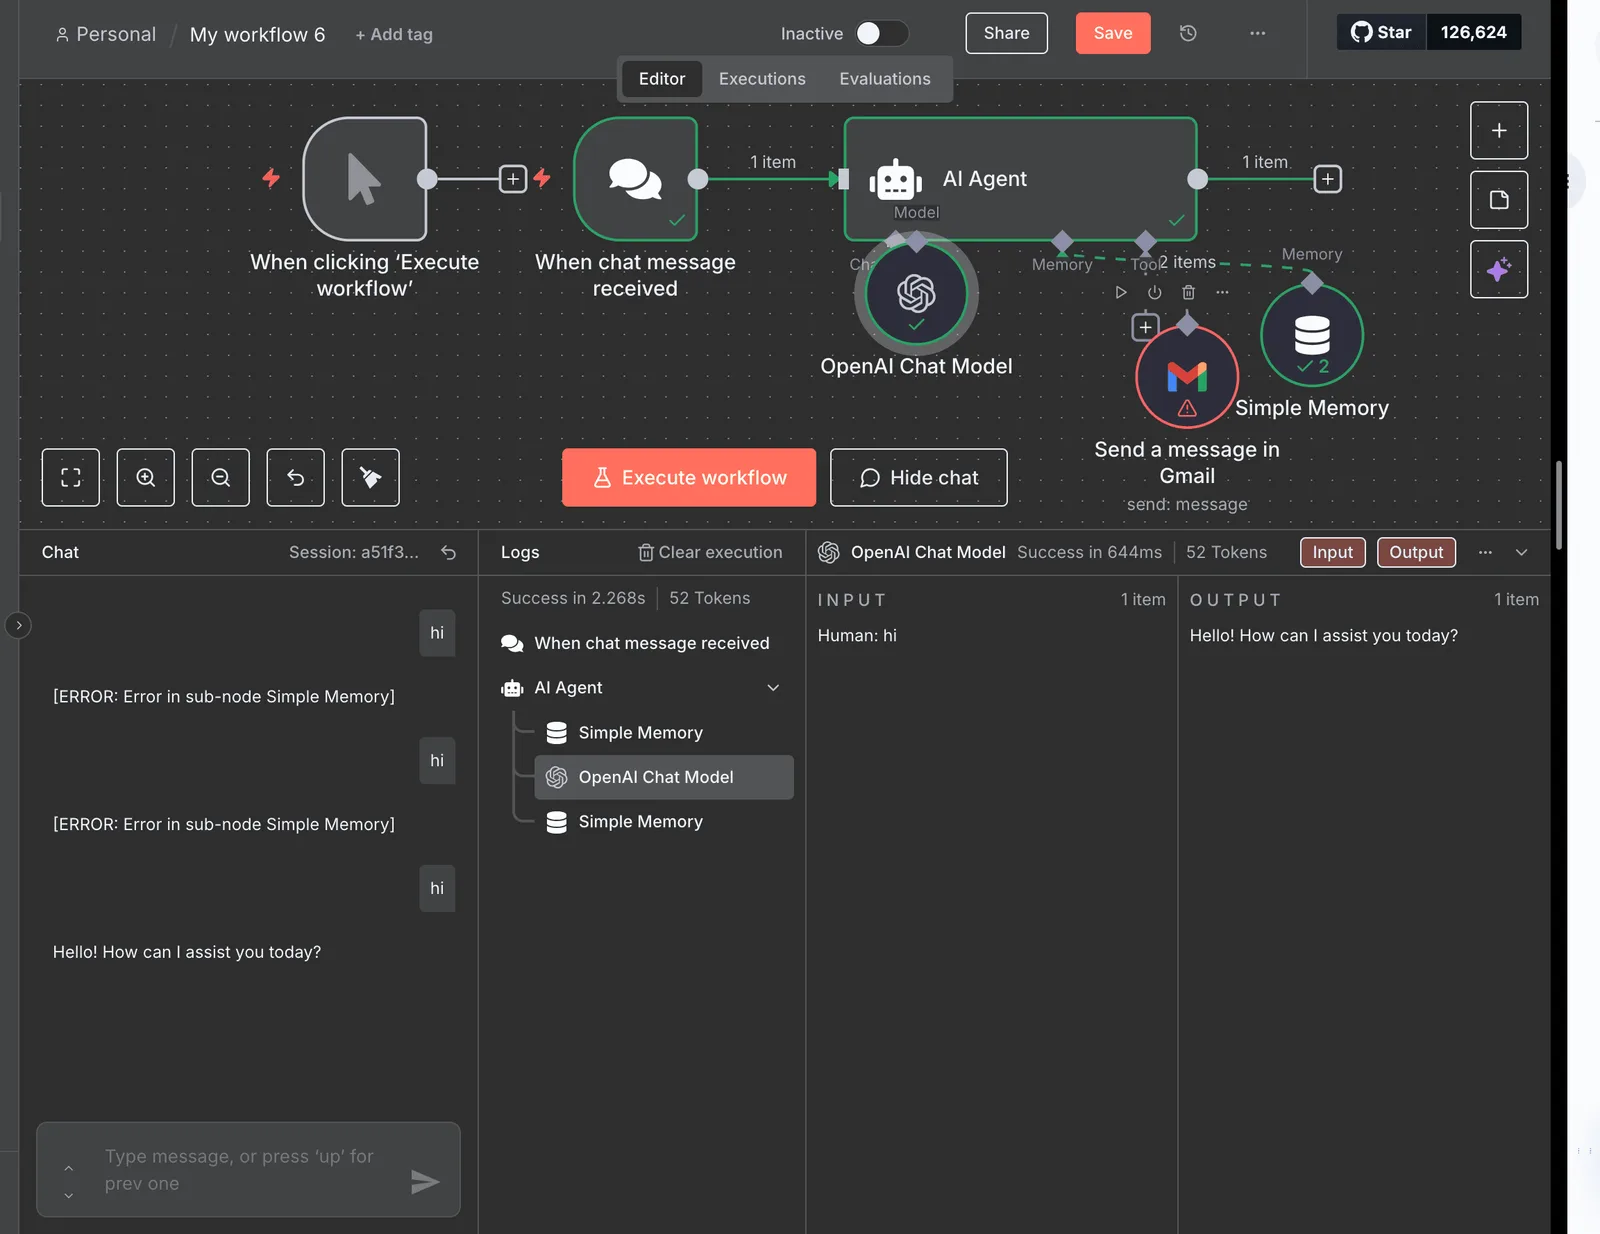
Take a chat-triggered agent that answers a one-line greeting. The run below completed in 644ms, with token counts logged against the model call, and a single agent run is the unit Datadog records.

That record is only useful if something acts on it. A trace that nobody opens is a dashboard nobody watches, and Datadog's real strength's that its monitors can page a named person through the escalation path you already defined.
For a team that promised a response-time or accuracy number, the sequence is clear: set a monitor on the metric and route the breach to the on-call rotation. Keep the trace as evidence for the postmortem.
Datadog LLM Observability cost and limits
Before you commit, three limits are worth stating.
First, cost at volume. Datadog prices on usage, and agents generate many spans per task: each model call, tool call and retry adds to the count. A chatty agent at production traffic can cost far more to observe than a simple request would suggest.

I haven't put a list price here. Read Datadog's own pricing page on the day you buy, since usage-based rates change, and model your expected spans per run before you sign.
Second, the monitor stops at the alert. Datadog tells a person that the agent breached its threshold.
It doesn't fix the cause, such as pausing the agent, rolling back a prompt or opening a ticket with the failing trace attached. Those steps stay manual unless you build them elsewhere.
Third, if your team isn't already on Datadog, you're adopting a full monitoring platform to measure one workload. The integration advantage disappears, and what's left is a bill and a learning curve.
LangSmith for LangChain agent tracing
Where the tool's job ends
When the alert fires, LangSmith's job ends. It traces, evaluates and alerts on latency and errors, and it's strongest for agents built on LangChain and LangGraph. Nothing in that description says who gets paged, who approves a fix, or what runs next.
Open any run and you see a tree of steps: the prompt, each model call, each tool call, and the output. The tracing is good. When an agent returns a wrong answer, you open the trace and see which step produced it.
Before a change ships, evaluation lets you score runs against test cases, which matters more than any dashboard, because it catches a regression before a customer does.
In a LangChain or LangGraph app, instrumentation's close to free, since the framework already knows its own step boundaries.
What a trace shows
In the run record below, the execution log lists input and output for each step: a user sends "hi", the agent replies "Hello! How can I assist you today?", and the chat panel shows an error raised by the memory sub-node.
The log is what a trace gives you, and the memory error shows what a trace can't do. It tells you the failure happened and where. It doesn't decide whether to wake anyone up.
Checking agent alerting before you buy
That's the gap to check before you buy.
Alerting on latency and error rate is only useful if you have defined the threshold, the window you measure it over, and the person who answers it. An alert rule that posts to a channel nobody watches is a dashboard with extra steps.
Ask the vendor how the alert leaves the tool, what receives it, and whether you can attach an approval or a ticket to it without writing your own glue.
LangSmith limits outside LangChain agents
Outside LangChain and LangGraph, you wire in the tracing yourself, and the value drops with every custom component you instrument by hand. That is the limit.
A team whose agent lives in a visual workflow builder, or who has no engineers to maintain instrumentation, pays for depth it can't use.
LangSmith fits an engineering team that owns a LangChain or LangGraph codebase and needs to see inside it. It doesn't fit a business team whose SLA is a promised response time and a named person on the other end of the alert.
Reading a table only gets you so far. Build the same workflow in Activepieces and compare it yourself.
Arize Phoenix OpenTelemetry tracing and evaluation
Arize Phoenix is an open-source tracing and evaluation tool built on OpenTelemetry. Like the other tracing tools, it ends at the trace: what happens when a number goes bad is still your job.
You can run it yourself, or use the hosted option from Arize, the company that maintains it.
Little locks you in, and that is its strength. OpenTelemetry is the vendor-neutral standard for emitting traces, so your instrumentation isn't written against one vendor's SDK.
If you leave Phoenix, the spans you already emit still work with another backend, and you're not re-instrumenting every agent. For a team that has been burned by a proprietary format before, that's a real reason to pick it.
Self-hosting adds a second benefit. Prompts, tool calls and customer data stay inside your own boundary, which settles the question of where trace data lives before a security review asks it.
It also means you run the service: storage, upgrades, and the on-call rotation for the monitoring tool itself.
Arize Phoenix production alerting limits
An SRE checks the alerting first, and that is where the limit sits. Tracing and evaluation are what Phoenix is documented for.
I couldn't confirm from the sources behind this article how deep its production alerting goes, or whether it produces SLA reporting you could hand to a customer. Before you rely on it for either, get answers to three questions:
- Can it alert on a latency threshold you set, and how long after the breach does the alert arrive?
- Can it alert on an error rate across a rolling window, rather than on a single failed trace?
- Does the alert reach a named person through a channel they actually watch, with a defined escalation path if they don't respond?
If any of those answers is "you can build it yourself", you have a dashboard, not an alerting system. A dashboard nobody is looking at at 3 a.m. doesn't meet an SLA, however good the traces behind it are.
If your team already speaks OpenTelemetry and wants to own its telemetry, Phoenix suits you, provided you have the people to wire up thresholds, paging and reporting yourselves.
A business team without engineers will get the traces and then have to build everything that turns them into a response. That's the same gap every tool in this group leaves open.
Activepieces
When a tracing tool says an SLA number has been breached, Activepieces takes the alert, routes it to a named person and waits for their decision.
It does that across 750 integrations, about 60% of them contributed by the community, so the Slack channel or ticket tracker you already use is most likely among them.
Don't rank Activepieces as a monitor, because it doesn't trace model calls. A trace backend can show a breach and still leave nobody woken up, and that's the dashboard-nobody-watches failure this article keeps coming back to.
When a threshold is crossed, your measurement backend fires a webhook, and the webhook-triggered workflow is the strength. The workflow posts to the on-call channel in Slack or opens a ticket in your tracker.
It can also pause for a human approval before anything irreversible happens, such as disabling an agent's tool access or rolling back a prompt.
Three agent services emit spans through one OpenTelemetry instrumentation layer, which connects by interchangeable plugs to Phoenix, the open-source tracing tool from Arize, running self-hosted, and to a second backend.
Take from it that the measurement side can be swapped without touching the instrumentation in the agents.
The same holds on the response side. Change the backend, which is the replaceable part, and the workflow that turns a breach into an action stays put.
Controls for production
Once a workflow can act on production, the controls that matter are the ones Activepieces lists:
- RBAC and SSO, so only the right people can edit or approve
- SCIM, so access follows your identity provider when someone leaves
- audit logs, so you can show who approved what
- log streaming, so run history reaches your own log store
- git sync, so workflow changes go through review like code
Those controls ship in the one product, and the list is the same whether you self-host or use Activepieces cloud, with no cut-down version on either side. Environments and event streaming are part of it too. MoneyGram, Moneypenny, Alan and FundingSocieties run Activepieces in production.
That settles where alert payloads, and any trace excerpts they carry, are processed.
I'm not quoting plan prices or limits here. Read Activepieces' own pricing page and docs, and you should check them on the day you decide.
Activepieces also won't tell you why latency rose; that's the tracing tool's job. Its job starts after the number is wrong.
Standalone tracing tools
Not every team needs a separate response layer, and pretending otherwise would weaken the comparison. On escalation coverage and alert quality, Datadog already does what this article asks for: a monitor on a latency SLO pages the person on a rotation you built long ago.
A team in that position should start there and add nothing.
The tracing tools win other questions outright. Langfuse and Phoenix keep traces inside your network, and because you run them yourselves, cost at volume follows your own storage rather than a per-span meter.
LangSmith wins on stack fit for a LangChain or LangGraph codebase, and its evaluation before release is a real reason to choose it.
The case for a response platform is narrower than a vendor would tell you. It applies when the alert has to become a ticket, an approval or a rollback, or when the person receiving it isn't an engineer.
If your pager already does that job, measure first and stop there.
How to start measuring agent SLAs
Monday, write down the two or three SLA numbers you promised customers, such as resolution time, error rate and answer accuracy. Then wire one monitor to one alert that reaches one named person.
Pick the monitor by where the agent runs and where its data may live. If traces contain customer records that must stay in your region or your network, that rules out some hosted options before you compare features. Choose one, not three.
You won't be starting from nothing. In LangChain's State of Agent Engineering survey, 89% of respondents have some form of observability, so having a dashboard is the baseline, not an achievement.
LangChain reports full tracing at 71.5% and step-level tracing at 62%, which means roughly four in ten teams can't see inside a single step when a run goes wrong.

Per LangChain, offline evals sit at 52% and online evals at 37%. Most teams therefore test before release, but fewer than four in ten score live traffic, so a drift in quality is found by a customer before it's found by a check.
If your SLA includes accuracy, set your one alert on a live score, not only on latency.
Setting SLA alert thresholds and response steps
Set a threshold with a number in it, for example "p95 resolution time above the promised figure for 15 minutes." A dashboard that turns red but pages no one isn't an alert. When it fires, the response should run in this order:
- The monitor fires a webhook with the metric, the threshold and the run ID.
- Your automation tool's webhook trigger receives it.
- A step posts the breach to the team's Slack channel, so everyone sees the same facts at once.
- A step opens a ticket in your tracker, so the breach has an owner and a timestamp.
- An approval step pauses for a named person, who decides whether to roll back, switch models or notify the customer.
Nothing consequential happens until a specific human says so, and the ticket records when they did. That pause is the point.
At the end of the week, open the first seven days of traces and check three things: how often the alert fired, whether each firing was real, and how long the named person took to respond.
Then recheck vendor prices, since trace volume drives cost and your first week is the first real measurement of it.
Related reading
References
Still comparing
The fastest way to settle it is to build something.
Open source under MIT, so you can self-host the same thing later.
Start free Talk to sales