
PagerDuty Datadog Integration: Setup Guide (2026)

Nov 20, 202614 min read
A PagerDuty Datadog integration is a connection that turns a Datadog monitor alert into a PagerDuty incident, and lets PagerDuty events flow back into Datadog. You can build it in a no-code workflow tool like Activepieces in an afternoon.
Vendor facts in this article were checked on 2026-11-20.
Build PagerDuty Datadog integration fast
How an alert becomes an incident
A monitor evaluates a metric on a schedule and changes state. On a state change it notifies a destination, and for paging that destination is an events endpoint that takes a routing key tied to one service.
The service's escalation policy decides who is paged, and a deduplication key decides whether the message opens a new incident or updates an open one.
The reverse direction is a webhook. The incident system posts a message on each lifecycle change, and something on the receiving end turns it into a log line, an annotation or a mute.
Four ways to connect PagerDuty and Datadog
The vendors' native integration is simplest, and it is enough when an alert should just page the on-call. A workflow tool sits in the middle when you need routing, enrichment or a chat notice.
A small script or serverless function that receives the webhook and calls the REST APIs gives full control, at the price of code you must maintain. Infrastructure-as-code, such as Terraform, suits teams that want monitors and services defined in version control.
The choice turns on who will maintain it, not on what is possible.
What teams actually automate between the two
Most teams automate one of three jobs, which means two remain manual. The first is paging: a Datadog monitor goes critical and the right PagerDuty service opens an incident.
The choice turns on who will maintain it, not on what is possible.
The second is enrichment, where a new incident gets context from Datadog, such as the monitor's query or a link to the dashboard, so the on-call engineer isn't hunting for it at 3 a.m.
The third job is cleanup: when an incident resolves in PagerDuty, the Datadog monitor is muted or annotated so the alert doesn't keep firing.
Pick one. A workflow that tries all three is hard to debug, and you won't know which step produced the duplicate page.
Requirements for the PagerDuty Datadog integration
Gather these first; missing keys are the most common reason a first run fails.
- An account with the workflow tool
- A PagerDuty API key
- A Datadog API key and application key, plus the Datadog site your organization uses
- One chosen job to automate
A key from one site is rejected by another, and the failure looks like a bad key rather than a wrong address. That is why the Datadog site matters: keys are issued per site.

The fastest path, and where the native integration stops
To get there fastest, build the workflow in Activepieces. PagerDuty and Datadog are both among its 750 integrations, counted from the open source monorepo, so the trigger from one app and the action in the other come from lists you can read.
Start from the single job you chose and run it with a test alert before you add anything else.
When your job needs an endpoint that isn't listed, such as a Datadog call the integration doesn't expose, don't guess at a field name or hope a setting exists. The native integrations only cover the triggers and actions they list.
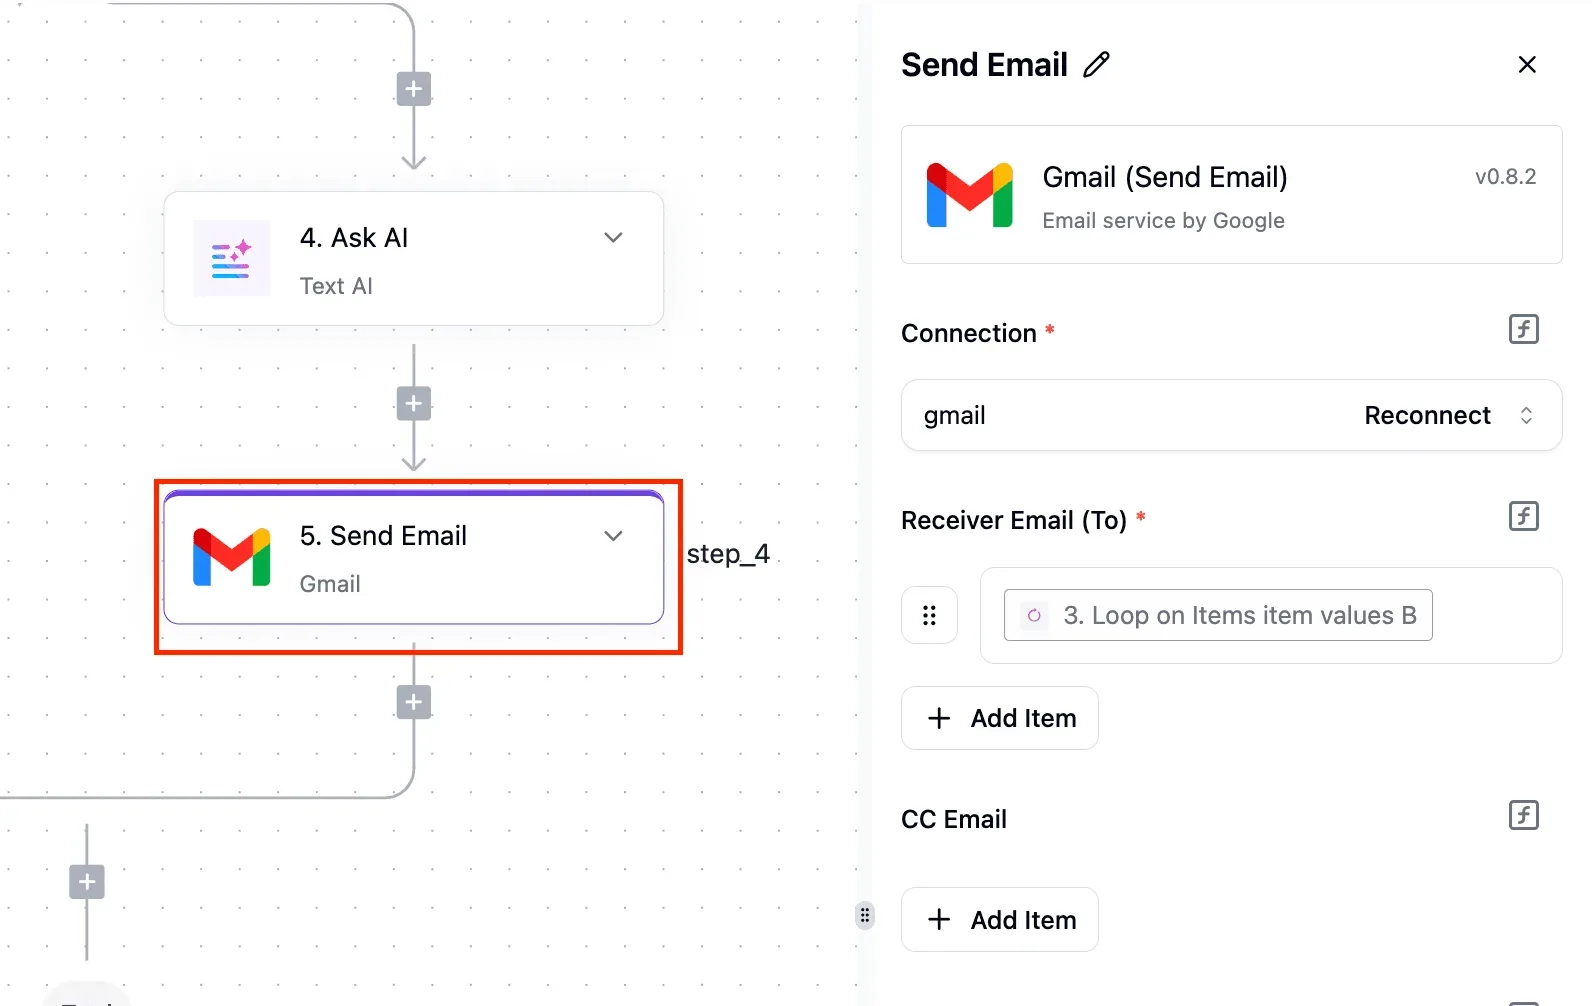
Add an HTTP request step or a webhook step and call the vendor's API directly, using the same keys you gathered above. That keeps the workflow no-code and avoids debugging a feature that was never there.
This takes minutes, not a project: automate it in Activepieces free.
Five PagerDuty and Datadog workflows worth building
Five workflows cover the job: Datadog alerts opening incidents, incident changes written back to Datadog, chat or ticket notices, resolution records, and an HTTP fallback for anything unlisted.
The table gives each one's trigger, actions and owner; take from it that PagerDuty supplies the triggers and Datadog supplies none.
| Workflow | Trigger | Actions | Owning app | Job |
|---|---|---|---|---|
| Datadog event to PagerDuty incident | Webhook step receiving a Datadog monitor alert | PagerDuty "Create Incident" | PagerDuty | Opens an incident from an alert |
| PagerDuty incident to Datadog event | PagerDuty "New Incident" | Datadog "Send One log" | Datadog | Puts the incident on the Datadog timeline |
| Incident to team chat or ticket | PagerDuty "Incident Acknowledged" | The chat or ticketing app's own post or create step | Chat or ticketing app | Tells people who someone owns it |
| Resolution to follow-up record | PagerDuty "Incident Resolved" | Datadog "Send One log" | Datadog | Closes the loop for the postmortem |
| Unlisted step | Any of the above | "Custom API Call" | PagerDuty or Datadog | Reaches endpoints with no ready-made action |
Every trigger and action named here comes from the published lists for PagerDuty and Datadog, which sit in the same open source monorepo as the rest of the catalogue, so you can read the source of any step.
Datadog alerts opening PagerDuty incidents
Because Datadog's integration lists no triggers, the Datadog-to-PagerDuty flow starts with a webhook step. Point a Datadog monitor's webhook notification at that step's URL, then add PagerDuty "Create Incident".
That means every alert you route here pages someone, so filter by monitor tag before the create step.
Writing PagerDuty incidents back to Datadog
For the reverse direction, PagerDuty "New Incident" fires the flow, and Datadog "Send One log" writes a line with the incident's title and ID.
The integration sends logs, not Datadog events. For a true event, use the fallback described below.
Chat notices and tickets from PagerDuty incidents
For chat or tickets, PagerDuty "Incident Acknowledged" is the better trigger than "New Incident", because it announces an owner rather than just an alarm. The chat or ticket step belongs to whichever app you use, so pick its action from that app's integration.
For the follow-up record, PagerDuty "Incident Resolved" triggers a second "Send One log" in Datadog. Pair it with the log from "New Incident" and you can see the full incident window in one query.
When the integration has a gap
Where neither integration lists what you need, such as Datadog events or PagerDuty calls like notes, use that piece's "Custom API Call" action, or an HTTP request step.
Build one workflow step by step in Activepieces
You build it in four stages. Each leaves you with something that runs: a flow with a trigger, working connections, a mapped action, then a tested and published flow.
Stage 1: Create the workflow and pick the trigger
Create a new flow and open the trigger step at the top of the canvas. Choose the app that starts the work, then pick from that integration's own trigger list. Don't pick the trigger you wish existed.
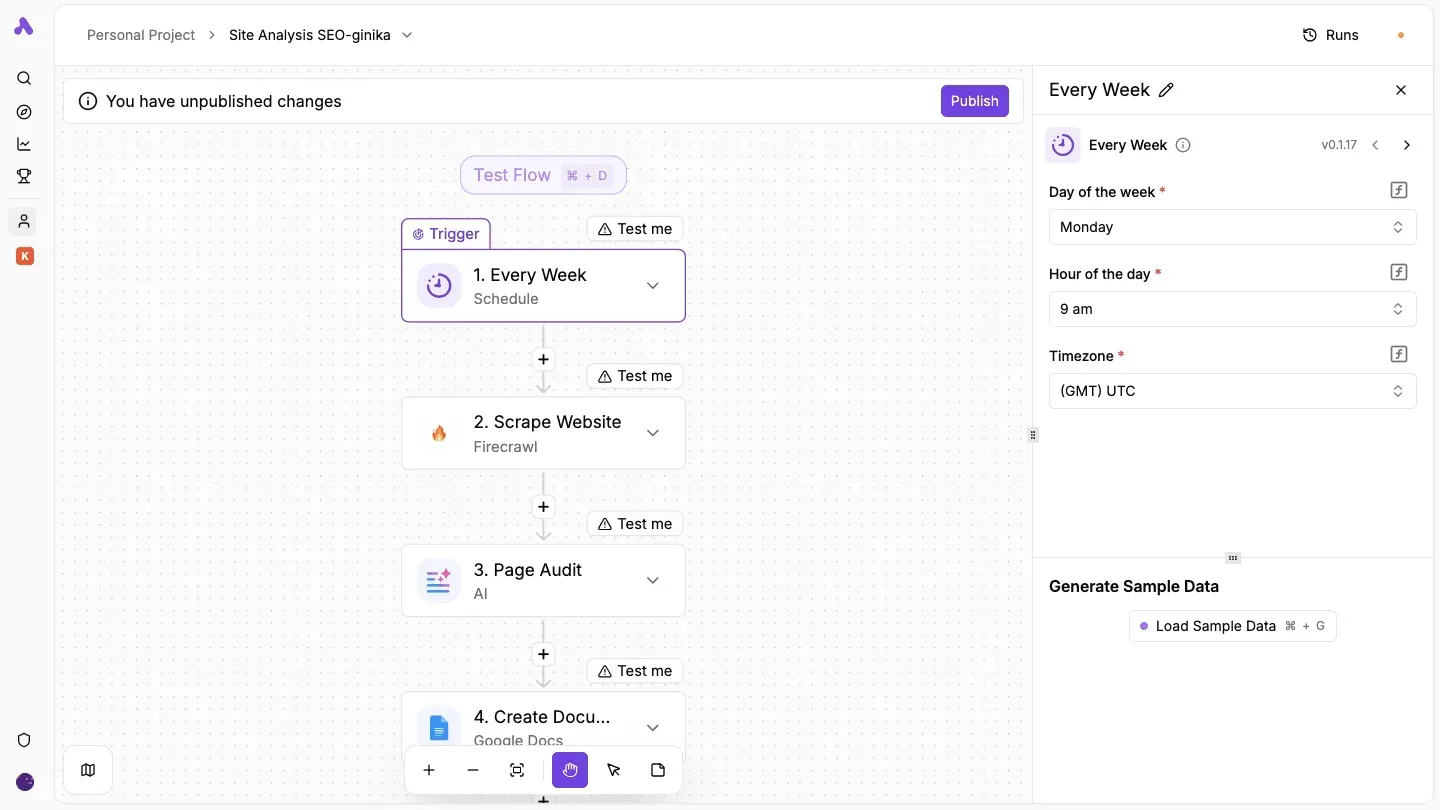
If the integration lists nothing close to your event, use a webhook trigger and point the other tool at that trigger's URL. Every plan, including free, allows unlimited flows, so a separate webhook flow per monitor costs nothing extra.
Stage 2: Connect PagerDuty and Datadog
The first time you use each integration, it asks for a connection, and the connection is stored separately from the flow. Create the PagerDuty connection and the Datadog connection now, before you build anything that depends on them.
Without a connection, a step can't load its dropdowns, and you'll waste time wondering why the fields are empty.
Stage 3: Add the action and map the fields
Add the action step and choose the operation from the integration's list. Then fill each field by clicking into it and selecting output from an earlier step, rather than typing a value.
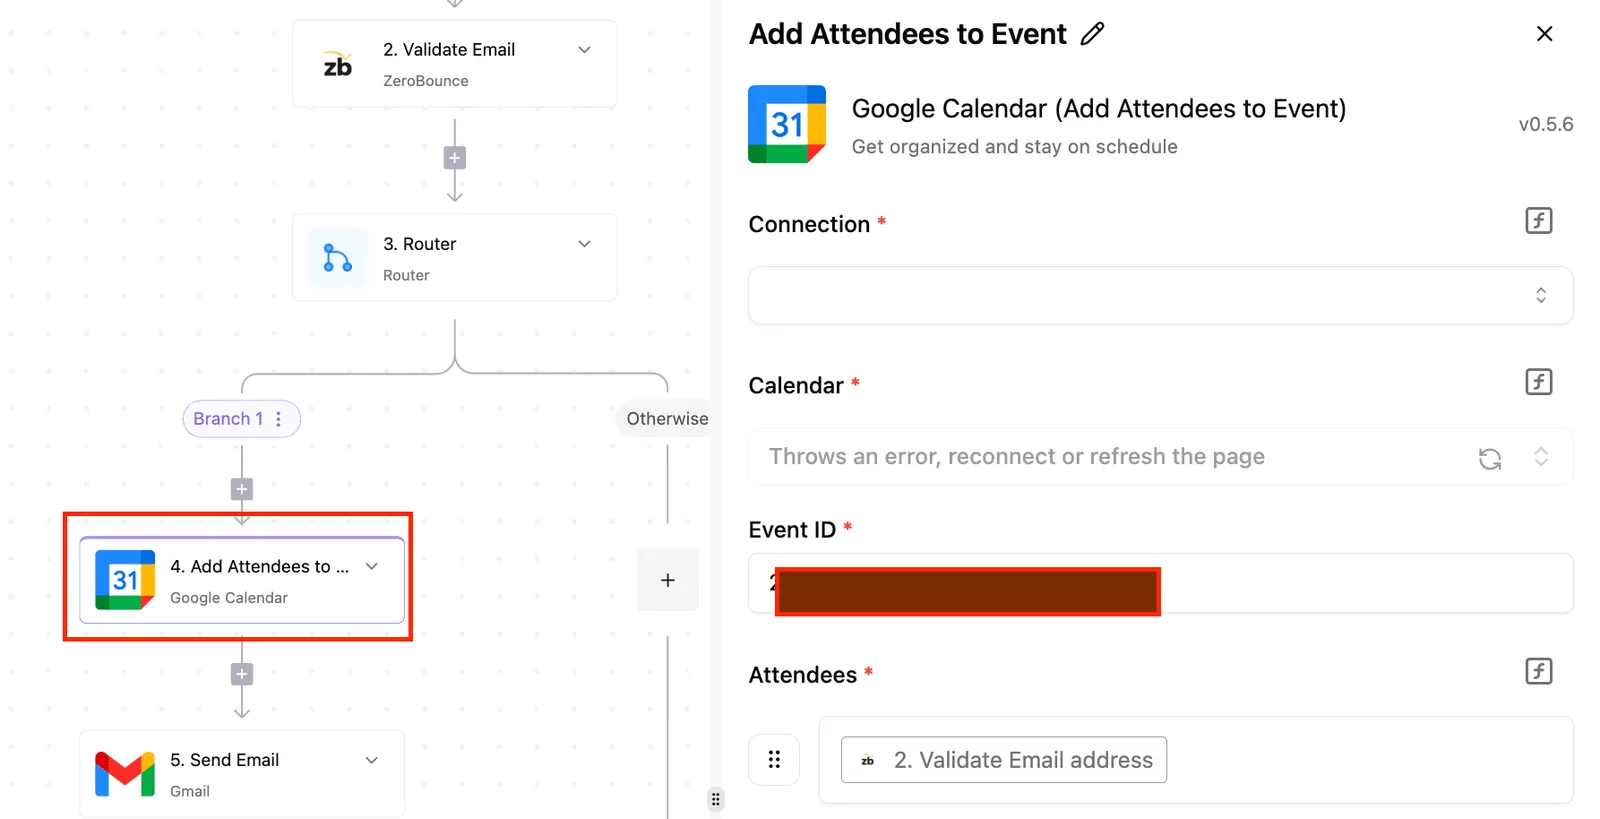
The canvas below shows the pattern: a trigger on top, two OpenAI steps, and a WordPress step selected with its Create Post action, so the AI component uses multiple sequential processing steps.
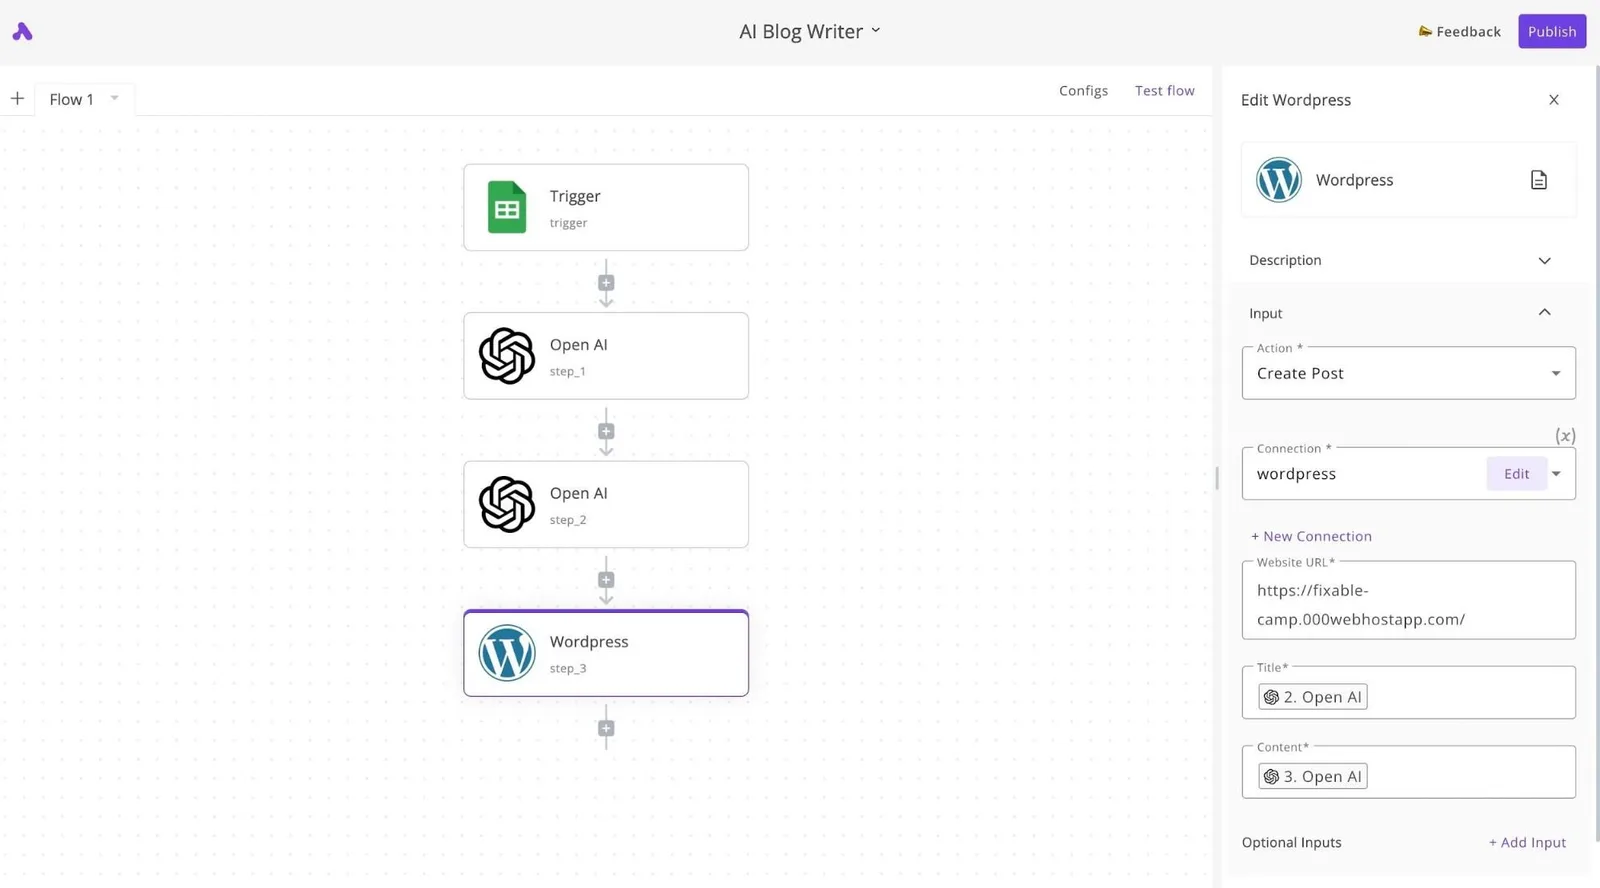
Its Title and Content fields hold references to the earlier steps, not typed text.
This is where most flows break. A reference to a field that is empty on some events leaves a blank in the finished record. Decide what each required field should hold when the source value is missing before you test.
Stage 4: Test with real data and publish
Work through this last stage in order:
- Test the flow against a real alert, not an invented one, and read the run history to see what each step received and returned.
- Open the output of every step and check that the mapped fields hold what you expect. A test that passes with a blank field has proved nothing.
- Fix the mapping where the output is wrong, then test the flow again.
- When every step returns sensible output, publish the flow.
- Then trigger one real event and watch the run history, because a published flow that has never run is still unproven.
If a step fails, the run history shows which step and what it received, which tells you whether to fix a mapping or replace the step with an HTTP request.
You can also skip the canvas: describe a Datadog monitor alert opening a PagerDuty incident with the severities mapped in Activepieces' built-in chat, and it publishes a live flow in your account, with the Datadog webhook trigger and the PagerDuty "Create Incident" step on the canvas and a run trace showing exactly what each step received.
That flow is the same kind of artefact you just built by hand, sitting under the same RBAC and audit logs as every hand-built flow, and MoneyGram, Moneypenny, Alan and FundingSocieties run Activepieces.
You can follow the rest of this with the builder open. Start free, no card.
Limits and errors when connecting PagerDuty and Datadog
When a run fails, the cause is usually one of six: wrong credentials or region, rate limits, duplicate incidents, missing fields, severity mismatches and feedback loops.
The table below lists each symptom with its cause and fix, checked against vendor documentation on 2026-11-20, so match what your run history shows to a row.
| Area | Symptom | Cause | Fix |
|---|---|---|---|
| Authentication | 401 or 403 on the first run | Wrong key type or wrong Datadog site | Use a routing key for events, an API token for REST, and the matching Datadog region |
| Rate limits | 429 responses in bursts | Many alerts hitting one PagerDuty key | Queue and retry with a delay |
| Duplicate incidents | Several incidents for one alert | No shared dedup key | Send a stable dedup_key |
| Missing fields | Blank service or description | Trigger payload lacks the field | Map a default or fetch it with an HTTP request |
| Severity mapping | Everything pages as critical | Datadog states don't match PagerDuty severities | Add an explicit mapping step |
| Feedback loops | Endless events and incidents | Workflow triggers on its own output | Filter on source or tag |
PagerDuty and Datadog rate limits and retries
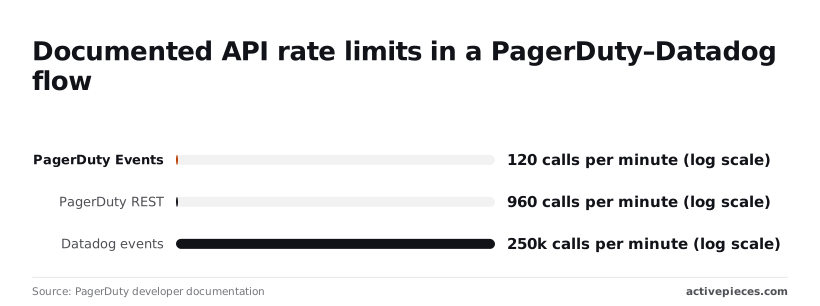
At 120 calls a minute per key for Events, per PagerDuty's documentation, a noisy monitor storm can hit 429s quickly and the workflow needs a retry. The same page gives REST at 960 calls a minute, enough for lookups but not for bulk updates.
Datadog events sit at 250,000 a minute, so Datadog is rarely the bottleneck and PagerDuty is the side to throttle. The chart below puts all three on a log scale, because they span three orders of magnitude.
Avoiding duplicate PagerDuty incidents and loops
When each alert evaluation creates a fresh incident, duplicates appear. Send the same dedup_key each time and PagerDuty folds repeats into one incident.
Without a guard, a workflow that writes a Datadog event on incident creation and also triggers on new Datadog events feeds itself. Filter out events carrying your own source or tag.

PagerDuty accepts only critical, error, warning and info as severities, so map Datadog's alert states explicitly, or everything pages at one level and on-call learns to ignore it.
When Activepieces fits better than other connection tools
Severity mapping is identical whichever tool carries it. Choose on constraints: a self-hosted, open-source builder fits when data must stay in-house or flows run long, and otherwise native integrations do the job.
Datadog's built-in PagerDuty integration and other automation platforms both connect these two apps. For a single alert-to-incident rule they are enough. Check each plan's step and run limits before you build, because a flow with four severity branches uses more steps than the diagram suggests.
There's also a different route: Datadog On-Call, Datadog's own paging product, which replaces PagerDuty instead of connecting to it. Incidentbot lists it at $20 per seat per month on an annual commitment, $24 month-to-month and $29 on-demand.

For a ten-person rotation, that's $200 a month annually against $290 on-demand, a $1,080 yearly difference for the same product. If you aren't ready to commit to a year, expect to pay for the flexibility.
The chart shows those three rates side by side. What to take from it is that commitment length, not headcount, sets the gap.
Which leaves the cases where building the flow yourself still wins:
- Open source, so you can read what a step does instead of guessing.
- Self-hosting, so alert payloads never leave your network.
- Unlimited steps on the builder's plans, so extra severity branches cost nothing more.
- Custom API Call, a step that reaches any endpoint the piece list leaves out.
If none of those apply, use the native integration and move on.
First PagerDuty Datadog workflow to build this week
Pick one noisy Datadog monitor, the one that already wakes someone up for no good reason. Build only that path: monitor alert in, PagerDuty incident out, with the four severities mapped explicitly. Leave routing, enrichment and notifications for later.
Frequently asked questions
These are the five questions the build steps leave open, answered from vendor documentation as of 2026-11-20.
Does PagerDuty have a built-in Datadog integration?
Yes. Both vendors maintain their own connection: Datadog can notify PagerDuty from a monitor, and PagerDuty lists Datadog as a service integration. That native path covers the plain case of an alert paging someone.
The workflow in this article only earns its place when you need something in between, such as enriching the alert, routing by tag, or posting to a channel.
Can I connect PagerDuty and Datadog for free?
Possibly, but the limits sit on the vendor side. Both companies have offered free or trial tiers with restricted features, and automation platforms usually cap runs on their free plans.
Can I self-host this workflow?
It depends on the automation platform, not on PagerDuty or Datadog. Both of those are hosted services, so you're only deciding where the middle step runs. If your platform ships a self-hosted edition, you can run it inside your network.
Once you self-host, you are responsible for uptime, so the tool that routes your pages must itself be monitored by something else.
What if the step I need isn't in the integration?
Use an HTTP request step against the vendor's REST API. Anything the prebuilt triggers and actions don't list is still reachable this way. Datadog's API takes an API key and an application key in request headers, and PagerDuty's takes a token.
How do I stop an alert from creating duplicate incidents?
Send a deduplication key with every trigger event. PagerDuty's Events API v2 accepts a dedup_key, and events sharing a key update the open incident instead of opening a new one. Build the key from something stable, like the Datadog monitor ID plus the alerting group.
Then trigger on state changes only, not on every re-notification. Finally, confirm that the native integration and your workflow aren't both firing on the same monitor, because two paths with different keys will always produce two incidents.

Related reading
References
Build it
Set this up in minutes.
No code required. Connect your accounts, and Activepieces runs it from there.
Start free Talk to sales