
What to check before blaming your integration platform
Integration platform failures often stem from external API constraints or data mapping errors rather than core system bugs.

Covers workflow automation for fintech and health-tech: tenant isolation, audit trails, and the failure modes that leak data across tenants.
ContributorSeptember 14, 202613 min read
This article was researched and fact-checked by an advanced research system.
Platform transparency refers to the architectural visibility that allows developers to inspect a codebase and verify whether an integration failure originated within the platform or from an external system.
Integration platform failure is rarely a platform problem
Most integration outages originate in the volatile environment surrounding the middleware rather than the execution engine itself.
While an engineer’s first instinct is to blame the runner when a workflow stops, the root cause is almost always a silent contract breach at the edge of the network.
Most integration outages originate in the volatile environment surrounding the middleware rather than the execution engine itself.
The three layers of a functional integration
A stable automated process relies on the alignment of three distinct technical layers, each possessing its own failure surface.
The first layer is the Upstream Provider, such as a CRM or ERP, which governs data availability; the second is the Connectivity Layer, where authentication handshakes occur; and the third is the Execution Engine, the role played by Activepieces, which processes the logic.
The following diagram illustrates how external volatility (rather than internal logic) accounts for the vast majority of production incidents.
While the platform is the central point of execution, this map shows it is surrounded by four primary external failure vectors that it cannot control.
When a workflow fails, the logs usually point to one of these external clouds rather than a collapse of the hub itself.
Why the integration platform gets blamed first
Because the middleware is the only place where the failure is visible, it becomes the default target for blame even when the error is a policy enforcement from an external API.
Authentication timeouts are the most frequent culprits, yet they appear to the user as a platform "disconnect."
Because the middleware is the only place where the failure is visible, it becomes the default target for blame even when the error is a policy enforcement from an external API.
For example, Salesforce allows for a minimum session timeout of only 30 minutes, meaning a low-traffic integration can lose its authorization context twice in a single lunch hour.
Similarly, Google Workspace enforces a maximum idle timeout of 180 minutes, which forces a re-authentication event every three hours regardless of the platform's uptime.
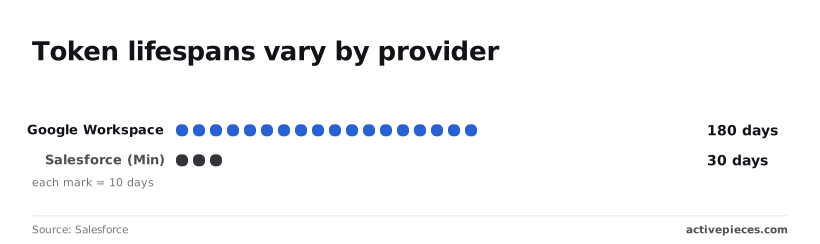
Because these 30 and 180-minute windows are governed by the provider's security policy, no amount of middleware stability can prevent the resulting 401 Unauthorized errors that stop a worker mid-stream.
Everything below works on Activepieces' free plan. Start without code or a credit card.
Verify API credentials and permission settings
Integration stability depends entirely on the persistent validity of the external connection, which is why most silent failures originate from the third-party provider rather than the local execution environment.
How expired OAuth tokens break integrations
The most frequent cause of middleware stalling is the expiration of OAuth refresh tokens, which forces a manual re-authentication flow that halts all automated data synchronization.
When a provider like the Google Workspace API invalidates a refresh token due to a password change or a security policy update, the worker loses its identity mid-transaction, resulting in a backlog of unsent records that must be manually replayed.
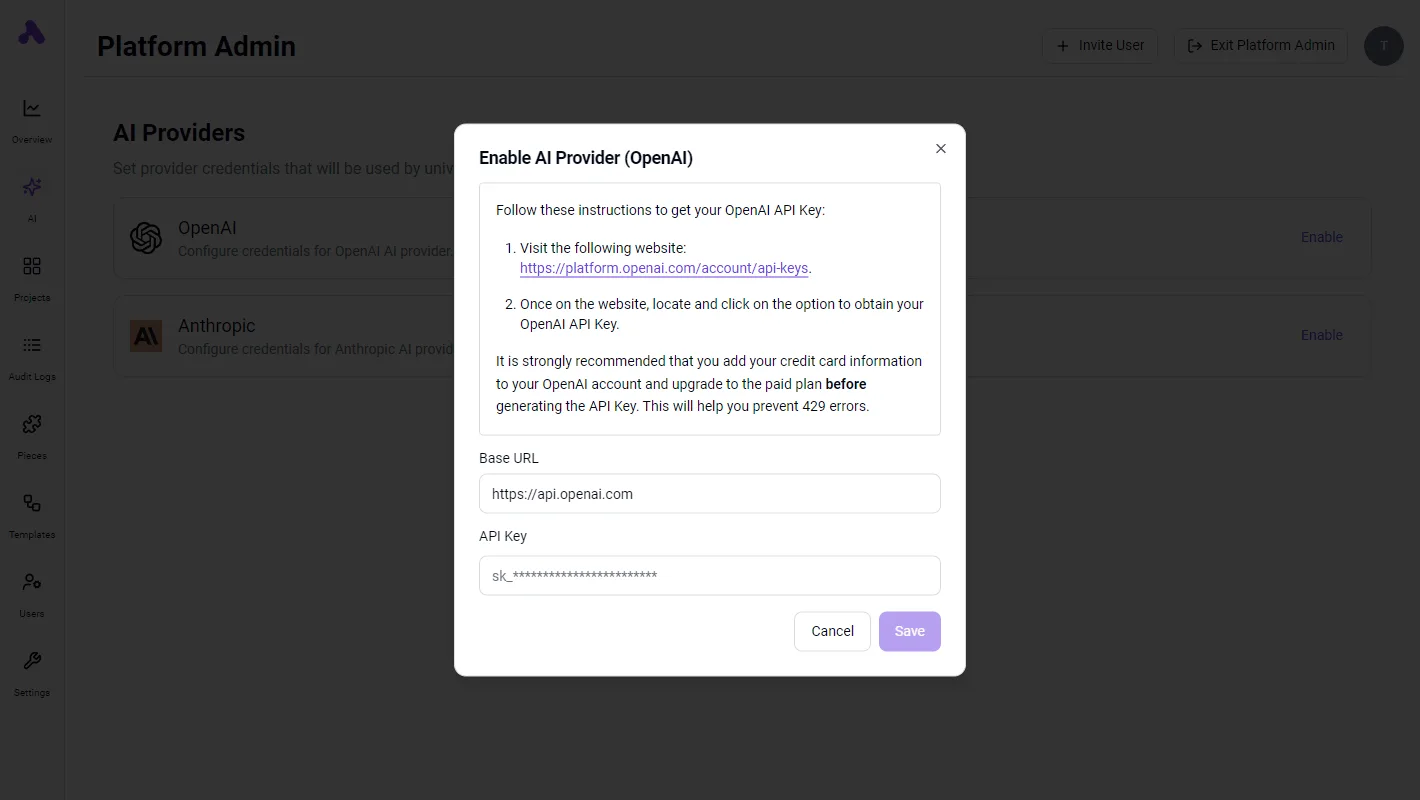
Security reviews often stall when a platform is a black box, but having an MIT-licensed core allows teams to verify the engine's integrity directly.
You can clone the Activepieces repository to inspect the queue and worker architecture yourself, providing the technical evidence needed to prove the platform is handling credentials correctly. This level of transparency allows for self-hosted or fully air-gapped deployments where you control the entire execution environment.
How schema drift breaks API integrations
When a provider adds mandatory fields or changes data types in a production environment, schema drift occurs, causing the integration to fail validation silently.
If a CRM like Salesforce introduces a new required field for a Lead object, any worker attempting to push data without that field will receive a rejection, meaning the business loses potential customer data until the mapping is updated.

How API rate limits cause integration failures
Throughput failures occur when a worker exceeds the provider's request ceiling, leading to 429 Too Many Requests errors that drop data packets.
| Shopify Tier | Requests Per Second |
|---|---|
| Standard | 2 |
| Plus | 20 |
| Enterprise | 40 |
If the business scales to a high-volume flash sale without upgrading its API contract, an integration built for a small shop will immediately crash.
When these limits are reached, the platform typically queues the remaining requests; however, if the queue depth exceeds the platform's memory limit, the oldest requests are purged, resulting in permanent data loss that is invisible to the user.
Managing memory and queue constraints
Users can mitigate these purge events by adjusting the platform's resource allocation to match their expected traffic spikes. In self-hosted environments, increasing the memory limit is achieved by modifying environment variables such as the worker memory limit or upgrading the underlying hardware specifications.
For those using managed cloud services, moving to a higher service tier provides the necessary overhead to sustain deep queues during external API throttling periods.
Identify data payload inconsistencies in workflows
Integration failures frequently stem from the content of the transmission rather than a failure of the transport layer itself.
When a platform reports a "Success" status, it only confirms that the HTTP request reached its destination, meaning the developer must manually audit the payload to identify why the downstream logic failed.
How missing required fields break workflows
A workflow fails when a source system emits an incomplete record that the destination system is configured to reject.
Even if the platform successfully triggers the automation, the absence of a single mandatory attribute causes the receiving API to return a 400 Bad Request error, which stops the data sync for that specific user, leaving their account information permanently out of alignment with the source system, rendering the integration effectively useless for maintaining data integrity, so the entire automated process fails to achieve its primary purpose of synchronization.
Common "Dirty Data" culprits that trigger these rejections include:
- Missing email addresses in CRM lead generation forms, which prevents the creation of a unique contact record.
- Null values in currency fields for accounting software, which causes the ledger to reject the entire invoice batch.
- Empty "Country" codes in shipping platforms, which halts the generation of postage labels.
Activepieces provides a per-step agent decision trace in the Run Details and Debugging UI, showing every tool call and the specific data an agent acted on alongside fixed workflow steps.
These traces can be streamed as audit logs into a SIEM, ensuring that an agent's reasoning is as checkable as a standard API call. Organizations like MoneyGram and FundingSocieties run this in production to maintain this level of granular oversight.
Encoding errors and unsupported characters
Text-based data often contains hidden formatting that legacy databases cannot process, leading to silent truncation or total record drops. A workflow might execute perfectly for years until a user enters a specific character that the platform's internal parser doesn't account for. This typically manifests as:
- Emojis or non-Latin characters entered into a legacy SQL database, which results in "String or binary data would be truncated" errors.
- Smart quotes from word processors pasted into command-line interfaces, which breaks the syntax of the resulting script.
Mapping mismatches after software updates
Schema mismatches occur when a third-party vendor updates their API without warning, changing the expected data type for an existing field.
A field that previously accepted a string might suddenly require an integer, causing every subsequent execution to fail because the platform is still sending the old format.
Network and infrastructure changes create false platform alerts
Infrastructure-level failures frequently masquerade as internal platform bugs because they disrupt the transport layer before the application logic can execute.
How IP whitelisting changes break connections
Security teams often update egress filtering rules or rotate static IP addresses to comply with quarterly rotation policies, which can silently sever the connection between a platform worker and a destination database.

If the platform’s worker architecture is opaque, an engineer cannot verify whether the platform is attempting to connect from a new, unlisted IP range or if the worker itself has crashed.
How DNS changes disrupt webhook delivery
Changes to CNAME records or the introduction of a new load balancer can cause global DNS propagation delays, resulting in intermittent webhook delivery failures as different regional nodes resolve to old IP addresses.

Without visibility into how the platform handles DNS caching, an engineer might spend hours debugging why a third-party service like the Stripe payment gateway reports a "404 Not Found" for a valid endpoint.
Regional cloud outages vs. global platform health
A localized failure in a specific cloud provider region, such as US-East-1, can cause a subset of integration tasks to fail while the platform’s status page remains green.
This discrepancy occurs because the platform's health check might monitor the global control plane rather than the specific regional workers processing the data.
Activepieces provides the visibility needed to clear the platform's name
Activepieces exposes the underlying TypeScript code for every "integration" (the platform's term for third-party connectors) so that engineers can verify exactly how a payload is transformed before it hits an external API.
This transparency ensures that when a sync fails, you can distinguish between a malformed request generated by the platform and a breaking change in the destination’s schema.
Step-by-step execution logs vs. generic error codes
Detailed execution traces replace the ambiguous "Internal Server Error" messages common in closed-source automation tools, allowing developers to see the raw input and output of every step in a flow.
The admin interface allows for direct management of these connectors, as seen in the Integrations management page where custom packages can be installed via the NPM Registry to override default behavior.
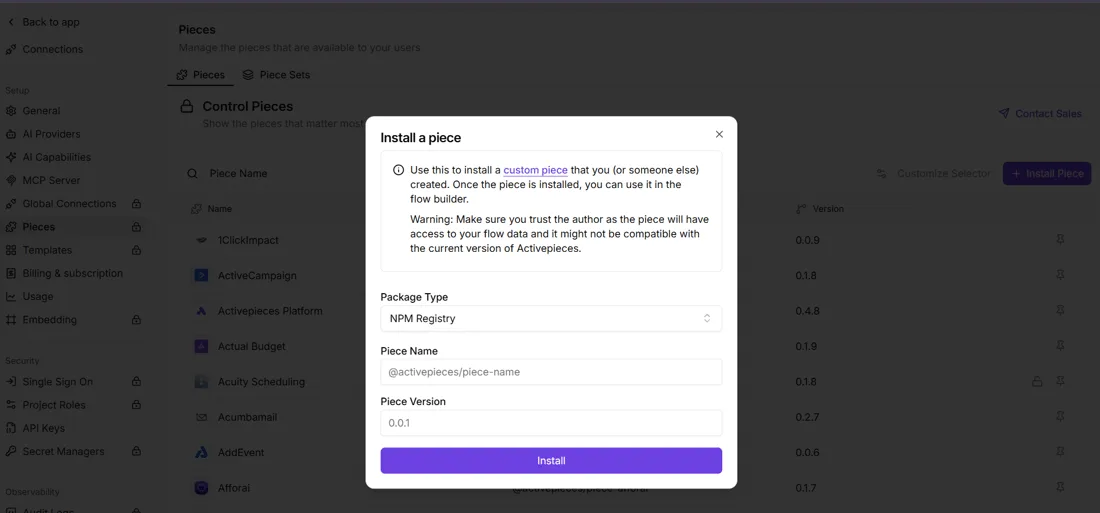
[INSERT SCREENSHOT: Activepieces admin interface showing the Integrations management page with a modal dialog open titled "Install a integration"]
This granular control over integration versions ensures that an engineer can pin a connector to a known-stable release, preventing an unannounced platform update from breaking production workflows.
Testing with sample data to isolate the break point
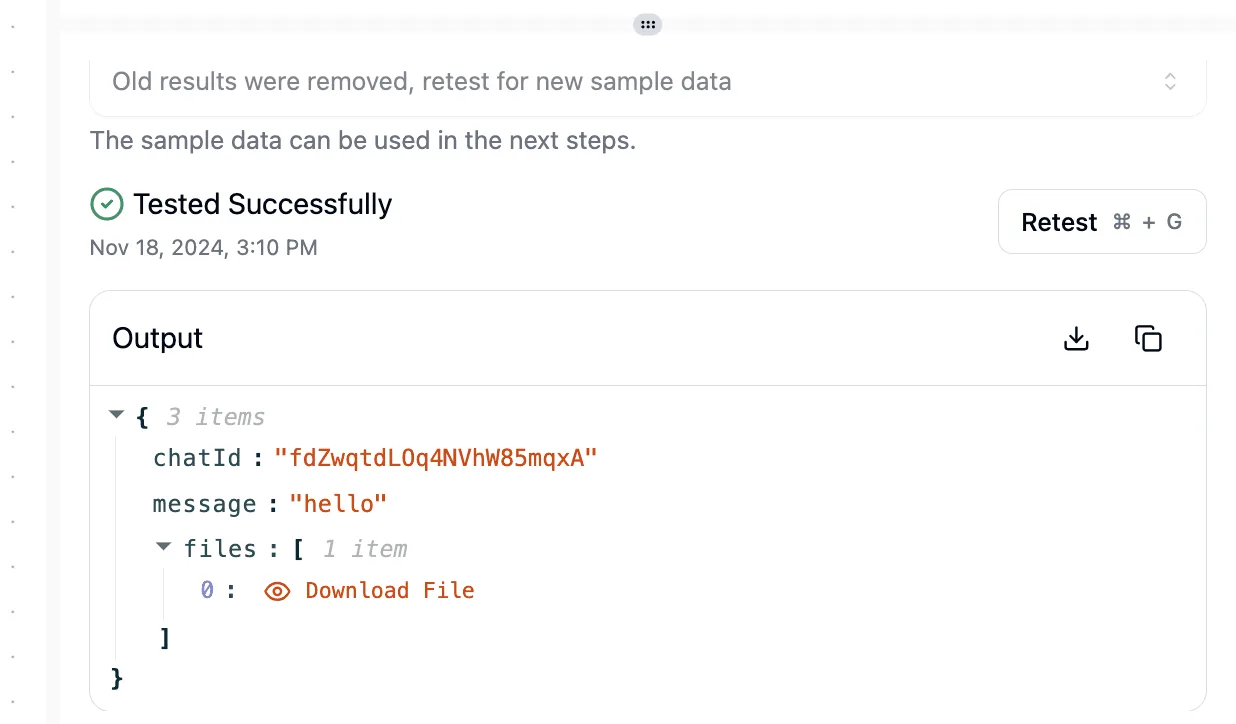
The platform’s testing environment allows for the manual injection of mock payloads into specific steps of a flow to confirm that the logic holds under edge-case conditions.
By running a single step with a sample JSON object, you can confirm that a transformation function (like a script that calculates tax) handles null values correctly, which prevents a single bad record from stalling the entire worker queue.
Automated retries for transient network blips
Activepieces utilizes a configurable retry mechanism that distinguishes between permanent 400-level client errors and transient 500-level server outages.
- Exponential backoff: prevents the platform from exhausting API rate limits during a destination outage.
- Manual re-runs: allow engineers to push failed executions through the flow once the external service is back online.
- Error handling branches: enable the definition of fallback logic, such as logging a failure to a database if the primary webhook fails to deliver.
The Monday morning integration triage checklist
A systematic review of the external environment and authentication state prevents teams from wasting hours debugging local code for failures caused by third-party downtime.
Check the status pages of the source and destination first
External API providers often experience regional outages or degraded performance that triggers a cascade of local integration errors.
Checking the status page of the source service, such as the payment processor Stripe, reveals if a spike in 500-level errors is a global incident, which means your engineering team can pause internal investigations until the provider restores service.

Check the last successful workflow execution time
Comparing the time of the first reported error against the last successful worker completion isolates whether a failure was triggered by a specific deployment or a silent environmental change.
- If the gap between success and failure aligns with a code push to the production branch, the triage focus shifts to a regression in the transformation logic.
- If successes and failures are interleaved, the issue likely stems from specific data payloads (such as a missing required field) rather than a total system collapse.
Re-authenticate your API connection to test tokens
Expired OAuth tokens or revoked API keys are the primary cause of sudden "Unauthorized" errors that mimic deeper architectural failures.
Forcing a re-authentication flow ensures the credentials held by the integration worker are valid, so you can definitively rule out identity management as the source of the outage.
Frequently asked questions about integration troubleshooting?
Why did my integration stop working without an error message?
When a platform consumes a webhook but fails to instantiate a worker, silent failures occur, often because the payload structure no longer matches the expected schema.
Because the platform returns a generic success status to the sending service, the logs appear clean while the downstream database remains empty.
Inspecting the worker architecture allows you to see if the engine is discarding "malformed" packets before they reach the execution stage, which confirms the issue is a contract mismatch rather than a platform outage.
How do I know if an API is rate-limiting my workflows?
Rate limiting manifests as intermittent execution gaps or partial data syncs where the platform receives a specific status code from the external provider.
By reviewing the raw HTTP exchange, you can identify if the service is returning a "429 Too Many Requests" response; this means your workflow is exceeding the provider's allowed throughput and requires a backoff strategy.
Can a change in one app break a completely different integration?
A change in a shared resource, such as a global authentication token or a common webhook URL, can trigger a cascade of failures across unrelated workflows.
If multiple integrations rely on a single service account, a permission change for one workflow may revoke access for all others, leading to a total shutdown of the integration suite.
Does the order of operations matter when debugging a workflow?
You will not find the bug in the platform logic until you have verified the source data, ensuring you are not chasing a bug that originated in the external environment.
- Check the source application to ensure the event was actually fired.
- Inspect the platform logs to see if the request reached the gateway.
- Review the worker execution history to identify logic errors within the transformation step.
- Validate the destination state to confirm the data was written correctly.